Figure 1.
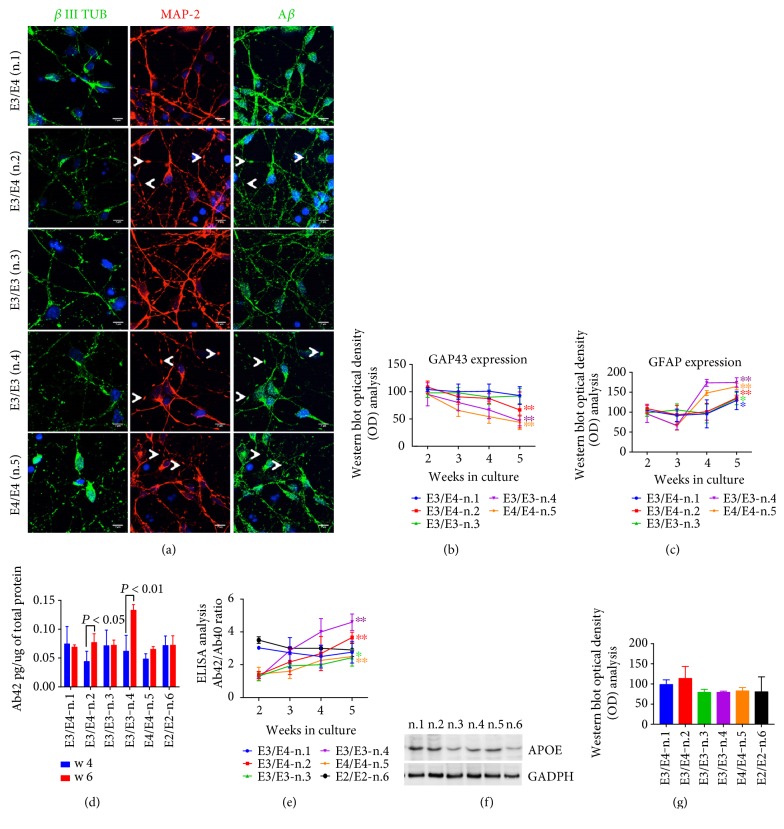
NSCs are completely differentiated after 5 weeks in culture. (a) β III Tubulin, MAP-2, and Aβ immunofluorescence analysis in stem cells with or without APOE4 allele expression. Note that the anti-Aβ antibody also detects full length APP. Pictures are representative of five different experiments performed in triplicate. Scale bar: 7 μm. Arrows show the appearance of swollen varicosities along the neurites, likely indicative of a progressive neurodegeneration. (b) Optical density (OD) analysis of GAP43 and (c) GFAP band intensity in NSCs carrying the APOE4 genotype from two to five weeks of culture. Data are normalized to the basal GADPH level and are expressed as % of the corresponding protein level at two weeks in culture. (d) ELISA quantitative analysis of Aβ42 levels in the media of neurons after four and six weeks in culture. (e) The ratio of Aβ42/Aβ40 (Ab42/Ab40) from two to five weeks in culture (2–5). Each data point is the mean ± SEM of triplicate determinations of five independent experiments (n = 5). ∗P < 0.05 and ∗∗P < 0.01 versus week three of each NSC. One-way ANOVA with post hoc Tukey's test. (f) WB analysis of Apo-E4 protein in culture of NSCs (n.1–6) after five weeks in culture. Densitometry analysis is reported in (g). Data are expressed as % of control (n.1).

