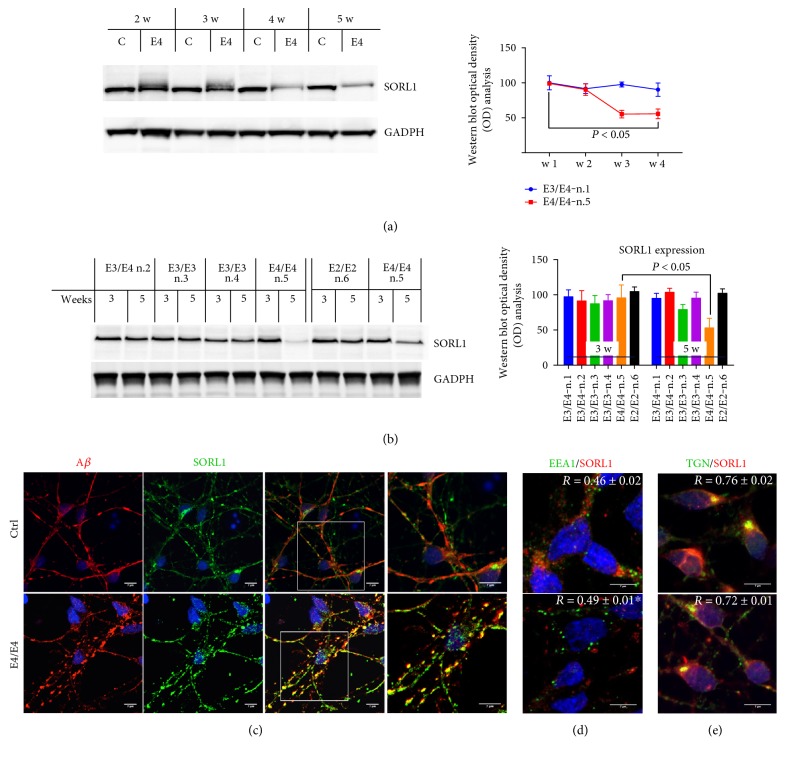
Figure 2.
SORL1 expression is decreased in neurons carrying the E4/E4 genotype. (a) WB analysis of SORL1 from control (C, n.1) and E4/E4 (E4) neurons from two to five weeks in culture. SORL1 expression levels were normalized to GADPH and expressed as % of the control (n.1). The quantification of band intensities (OD) is reported on the right. n = 4, P < 0.05 versus week three. One-way ANOVA with post hoc Tukey's test. (b) WB analysis of SORL1 in neurons with or without APOE4 allele expression after three and five weeks in culture. SORL1 expression levels were normalized to GADPH and expressed as % of the control (n.1). The figure also reports SORL1 expression levels in 74-year healthy donors (n.6). The quantification of band intensities (OD) is reported on the right. n = 4; one-way ANOVA with post hoc Tukey's test. P < 0.05 versus three weeks. (c) Confocal microscopy analysis of control and E4/E4 neurons after 5 weeks. Neurons are marked with mouse anti-Aβ and rabbit anti-SORL1 antibodies. High magnification is shown on the right. Colocalization analysis of control and E4/E4 neurons by using (d) mouse anti-EEA1 and rabbit anti-SORL1 antibodies and (e) mouse anti-TGN and rabbit anti-SORL1 antibodies. Colocalization analysis was performed using the Zen software. The (R) coefficient (Pearson's coefficient) was used for quantitative comparisons between control (Ctrl) and E4/E4 neurons (R). The data are expressed as mean ± SEM. n = 10 Student's t-test ∗P < 0.05 versus control (n.1).

