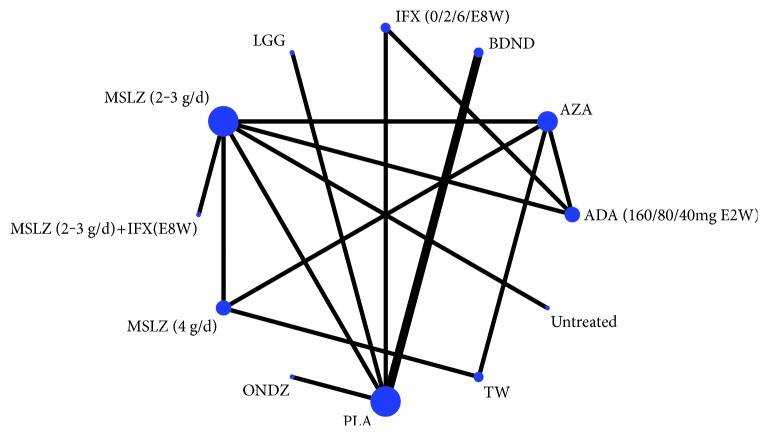
Figure 3.
Network diagram. The size of the nodes was according to the number of patients that have received each treatment and the edges according to the mean control group risk for all comparisons versus placebo. PLA, placebo; untreated, blank control group; MSLZ, mesalazine; BDND, budesonide; AZA, azathioprine; IFX, infliximab; ADA, adalimumab; TW, Tripterygium wilfordii; LGG, Lactobacillus GG.

