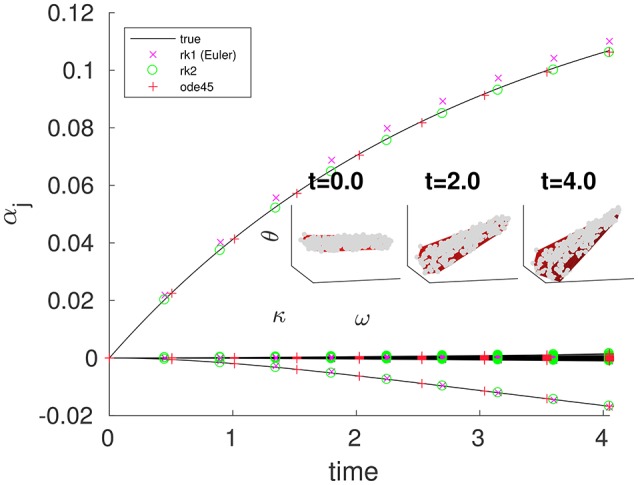
Figure 4.

Coarse projective integration shows smooth evolution of the first few leading PCE coefficients αj, with some corresponding fine states visible in the 3D insets. Black curves (in the main figure) and dense gray scatters (in the insets) were obtained by full fine integration with the same initial θ conditions using MATLAB's ode23. Colored points (in the main figure) and red surfaces (in the insets) were obtained via CPI, using several different integrators. At each coarse step, was estimated ∀k = 1, …, M (where M = 28) by drawing M chords through the restrictions of the last two points in a brief burst of fine integration of τ = 0.05 time units. At the times indicated, we make inset plots with red surfaces corresponding to the lifted CPI state and gray scatters corresponding to the closest (in time) state in the true trajectory. These should be compared to Figure 2. We performed the same task for several outer integrators: two explicit Runge-Kutta integration schemes, and a coarse wrapper around the built-in MATLAB integrator ode45 are compared to the restrictions of points in the fine trajectory starting from the same lifted initial condition. For the two explicit Runge-Kutta integrators, an outer step of h = 0.45 was used. For ode45, an absolute tolerance of 10−6.0 and a relative tolerance of 10−12.0 were used. N = 300, K = 1, and M = 28 were used. The ω-values were drawn from a truncated normal distribution supported on [−0.100, 0.100], with zero mean and standard deviation 0.060.
