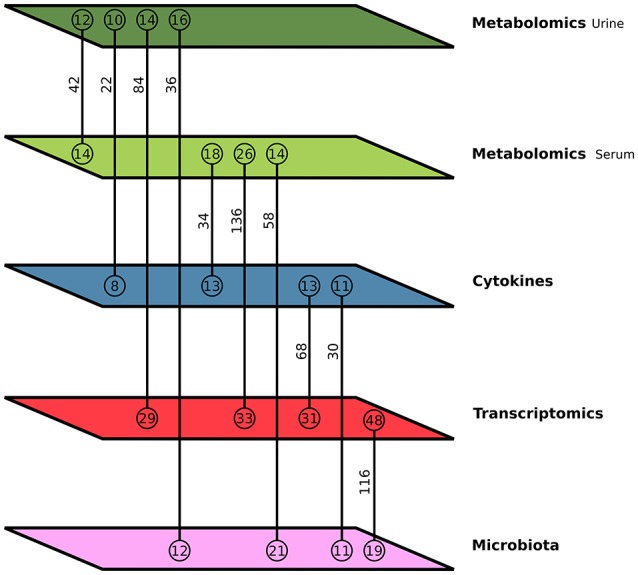
Figure 2.

Multilevel integration. This schematic image shows the number of connections between each internal phenotypic level with the other levels in a merged network. The colors of the parallelograms denote the internal phenotypic level to which the data-types belong. Green is Metabolomics (light green—Metabolite from Serum and dark green—Metabolite from Urine), blue is Cytokines, red is Transcriptomics, and pink is Microbiota. Each line connects two levels and the vertical number above the line indicates the number of edges in the correlation network between those two phenotypic levels. The number of connected nodes in each level is given in circles above and below the connecting lines.
