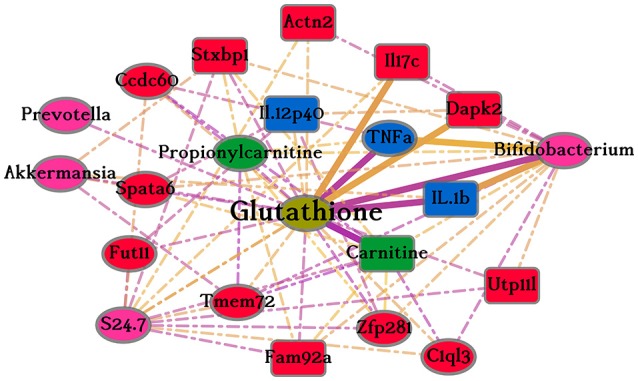
Figure 4.

Glutathione sub-network. This figure shows the 21 connections of the node Glutathione in the merged network. The different colors of nodes indicate the data-type of internal phenotypic level of that node, pink is Microbiota, red is Transcriptomics, blue is Cytokines, and green is Metabolites (light green—Metabolites from Serum and dark green—Metabolites from Urine). Oval nodes are connectivity hubs. Dotted lines show un-validated edges and continuous, thicker edges show connections also present in the results retrieved from scientific literature. Edge color, yellow and purple, indicates positive and negative correlations, respectively.
