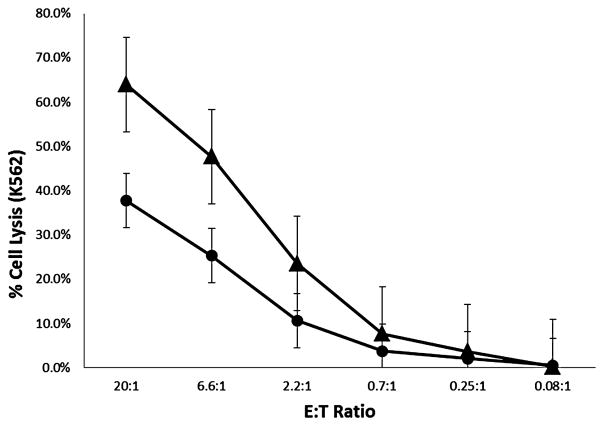
Fig. 2.
Summary of cytotoxicity data. Cytotoxicity assays were performed on products shown in Table 1. The mean percentage of tumor cell lysis ± standard error is shown as a function of the effector cell to tumor (target) cell ratio (E : T). The results of the cytotoxicity assay for the shipped, IL-2–stimulated cells (▲) were compared to the activity of same cells that were not incubated with IL-2 and not shipped (●).

