
Figure 3.
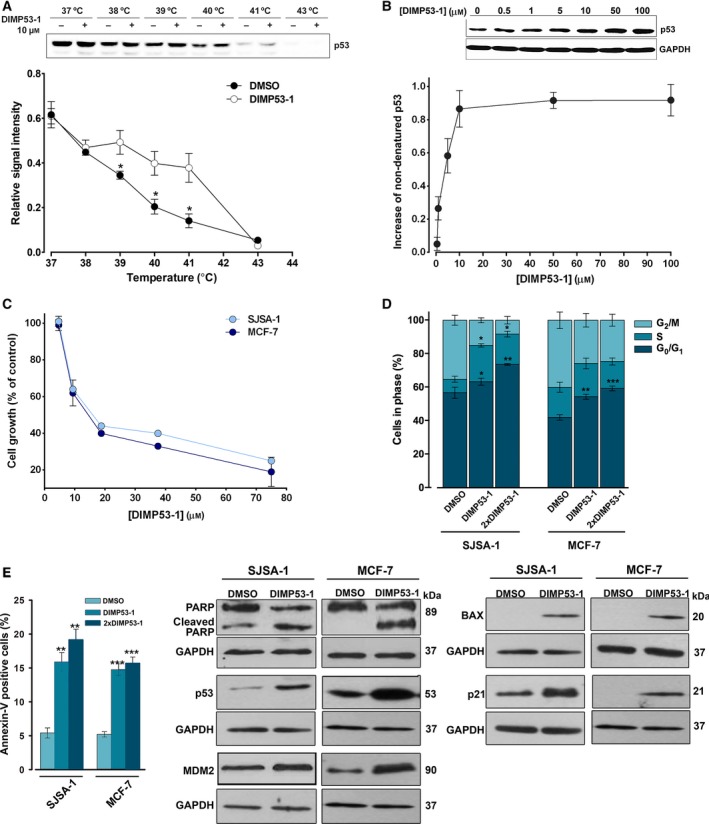
DIMP53‐1 potentially binds to p53 and inhibits the growth of MDM2‐ and MDMX‐overexpressing tumor cells through induction of cell cycle arrest, apoptosis, and upregulation of p53 target genes. (A and B) CETSA experiments were performed in HCT116p53+/+ cell lysates in the presence or absence of DIMP53‐1. In (A), 10 μm of DIMP53‐1 was used and lysate samples were heated at different temperatures; plot represents the signal intensity normalized to the intensity at 25 °C. In (B), lysate samples were treated with increasing DIMP53‐1 concentrations and heated at 39 °C; plot represents the increase in nondenatured p53 calculated setting the signal obtained with DMSO at 39 °C as 0, and the signal obtained with DMSO at 25 °C (considered the maximum amount of nondenatured p53) as 1. Results are mean ± SEM of three independent experiments. (C) DIMP53‐1 concentration–response growth curves in SJSA‐1 and MCF‐7 cells, after 48‐h treatment; data are mean ± SEM of four independent experiments; incubation with DMSO, in equivalent % of DIMP53‐1, was used to normalize the results. (D,E) Cell cycle arrest (D) and apoptosis (E) were determined in SJSA‐1 and MCF‐7 cells at IC 50 and 2 × IC 50 (2 × DIMP53‐1) concentrations, after 24‐h treatment; data are mean ± SEM of three independent experiments; values were significantly different from DMSO (*P < 0.05; **P < 0.01; ***P < 0.001). (F) Western blot analysis was performed in SJSA‐1 and MCF‐7 cells, after 24‐h (p21) and 48‐h (PARP, p53, MDM2, BAX) treatments with the IC 50 of DIMP53‐1 or DMSO. In (A), (B), and (F), immunoblots are representative of three independent experiments; in (B) and (F), GAPDH was used as loading control.