
Figure 5.
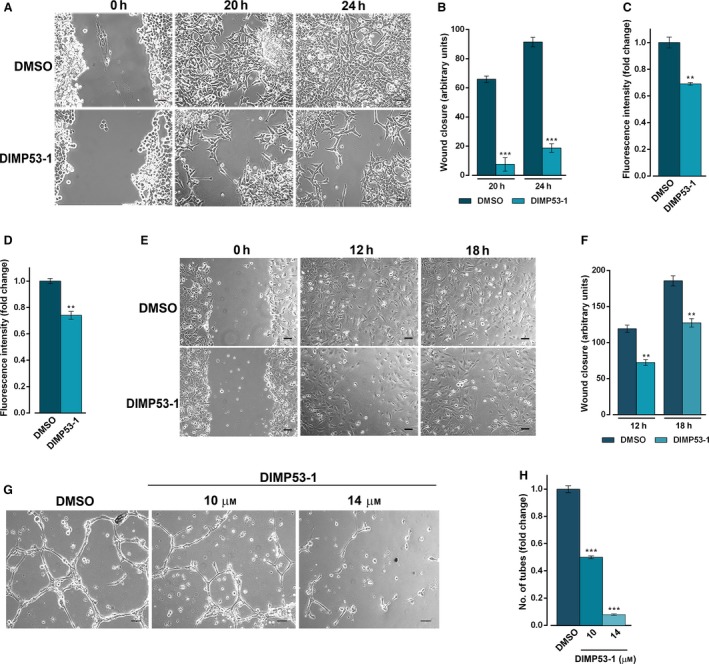
DIMP53‐1 prevents in vitro angiogenesis and tumor cell invasion and migration. (A,B) HCT116p53+/+ confluent cells treated with 3 μm DIMP53‐1 or DMSO were observed at different time‐points in the wound healing assay. (B) Quantification of wound closure of HCT116p53+/+ cells in five randomly selected microscopic fields. (C) Effect of 3 μm of DIMP53‐1 on the migration of HCT116p53+/+ cells for 24 h, analyzed by the chemotaxis assay. (D) Effect of 3 μm of DIMP53‐1 on the invasion of HCT116p53+/+ cells for 48 h, analyzed by cell invasion assay. In (C) and (D), migratory cells were quantified by fluorescence signal; fold changes are relative to DMSO and correspond to mean ± SEM of three independent experiments. (E,F) HMVEC‐D endothelial confluent cells treated with 14 μm of DIMP53‐1 or DMSO were observed at different time‐points in the wound healing assay. In (F), quantification of wound closure of HMVEC‐D endothelial in five randomly selected microscopic fields. (G) Antiangiogenic effect of 10 and 14 μm of DIMP53‐1 was evaluated in HMVEC‐D cells for 16 h by the endothelial cell tube formation assay. (H) Quantification of tube‐like structures in five randomly selected microscopic fields; fold changes are relative to DMSO and correspond to mean ± SEM of three independent experiments. In (A), (E), and (G), scale bar = 5 μm and magnification = 100 ×. In (B), (C), (D), (F), and (H), values were significantly different from DMSO (**P < 0.01; ***P < 0.001).