
Figure 1.
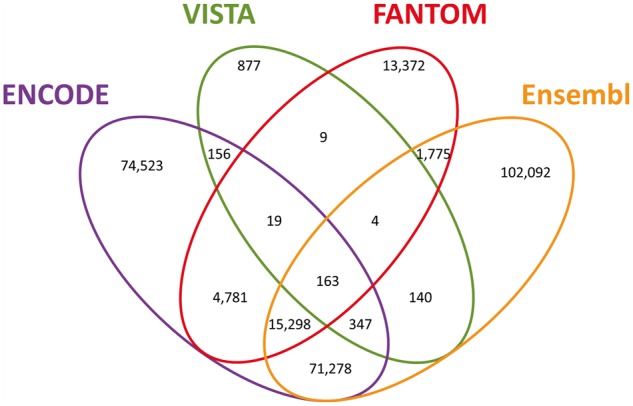
GeneHancer candidate enhancers. Venn diagram of the 284 834 candidate enhancers, split by the sources reporting each enhancer. Pairwise comparisons statistics (P, Fisher’s exact test P-value; OR, odds ratio; C, Clusters count): ENCODE–Ensembl (P = 8.1 × 10−319; OR = 19.6; C = 87 086), ENCODE–FANTOM (P = 1.9 × 10−319; OR = 17.1; C = 20 261), ENCODE–VISTA (P = 1.9 × 10−140; OR = 3.6; C = 685), Ensembl–FANTOM (P = 1.9 × 10−319; OR = 9.8; C = 17 240), Ensembl–VISTA (P = 5.8 × 10−136; OR = 3.5; C = 654), FANTOM–VISTA (P = 1.1 × 10−51; OR = 4.1; C = 195).