
Figure 2.
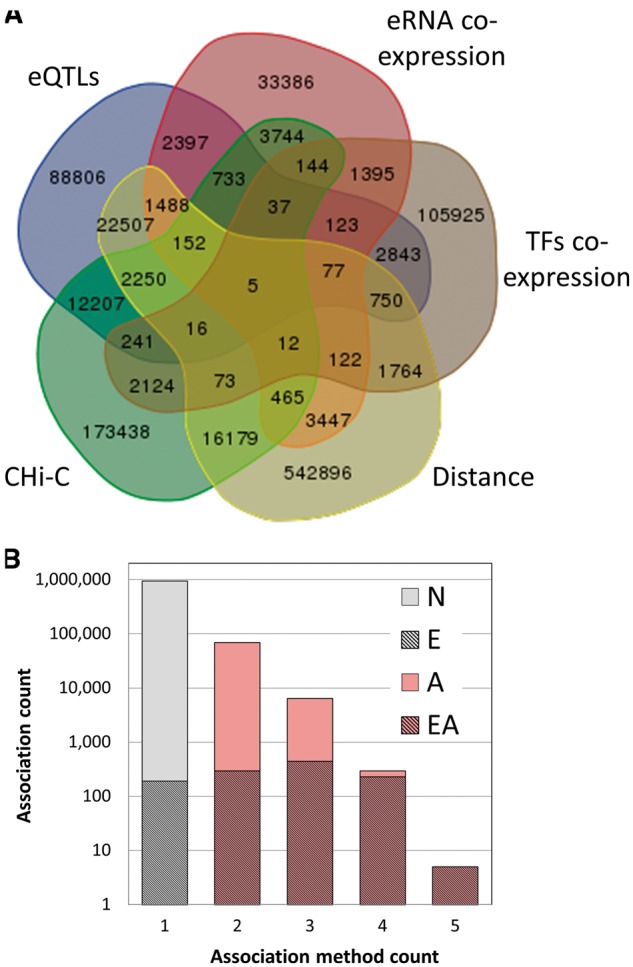
GeneHancer enhancer–gene associations. (A) Venn diagram of the 1 019 746 enhancer–gene pairs, grouped by the five distinct association methods. (B) Dependence of the count of gene–enhancer associations on the number of the relevant supporting methods. Gray, associations supported by one method only; pink, associations supported by multiple methods (elite associations); hatched, elite enhancers, with their proportion in each bin shown in a linear scale. ‘N’, no elite status; ‘E’, elite enhancer only (38% of total associations supported by one method); ‘A’, elite association only; ‘EA’, both elite enhancer and elite association (double elite). The proportions for double elite are 51%, 70%, 96%, 100% for method count 2, 3, 4 and 5, respectively.