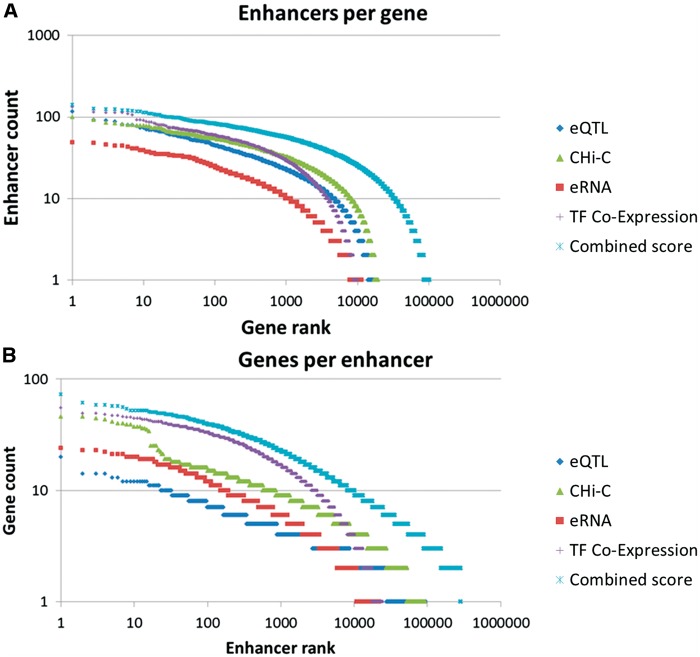
Figure 3.
Gene–enhancer associations. Rank plots of (A) enhancer per gene counts and (B) gene per enhancer counts, using individual association methods and the combined method. The nearest neighbor method was not included in those charts since for most enhancers this approach promiscuously added its two flanking genes.

