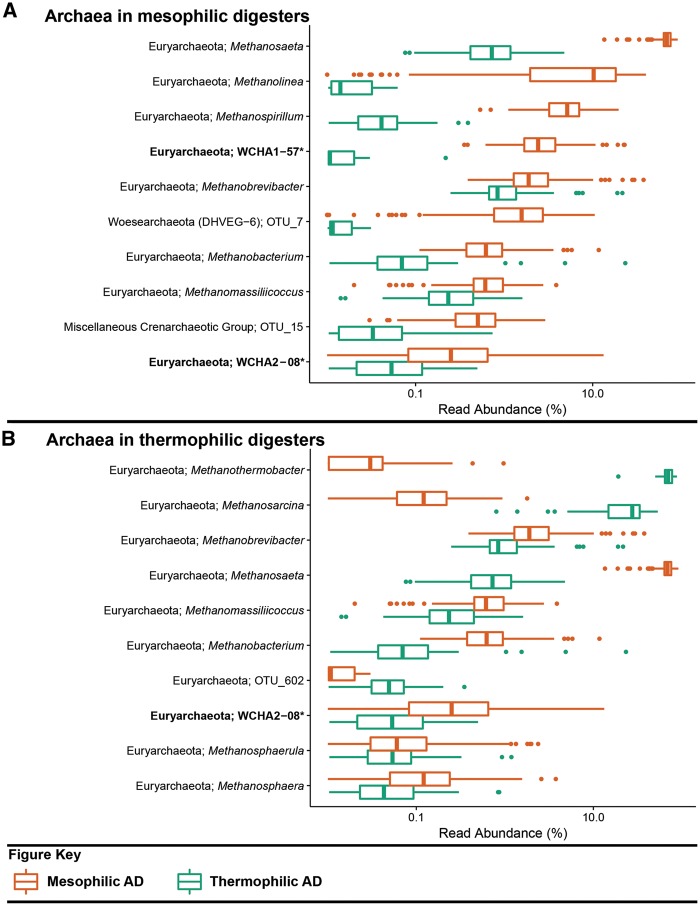
Figure 3.
Box plot for the distribution of the 10 most abundant archaeal genus-level-taxa by median abundance in A. mesophilic and B. thermophilic anaerobic digesters. Amplicon abundance values (V3-5 region) are given as a percentage of total archaeal reads for each phylotype (19). *Novel MiDAS genus level taxa are given in bold.

