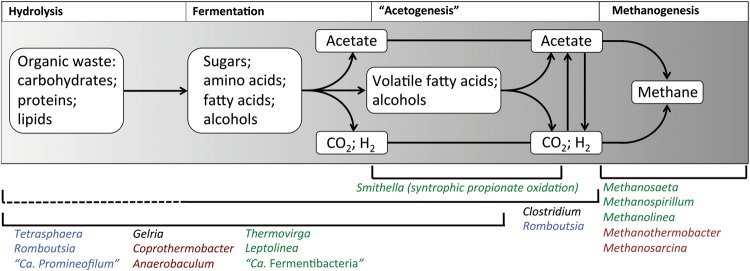
Figure 5.
Basic outline of the carbon flow for the anaerobic digestion process. A selection of organisms found to be abundant in Danish systems that are associated with these process steps are listed for each (indicated by brackets, broken lines indicate uncertainty about the pathway in these organisms). Font colour indicates their niche system (green = mesophilic ADs; burgundy = thermophilic ADs; black = both mesophilic and thermophilic ADs; blue = abundant in both AS and recipient ADs).

