
Figure 3.
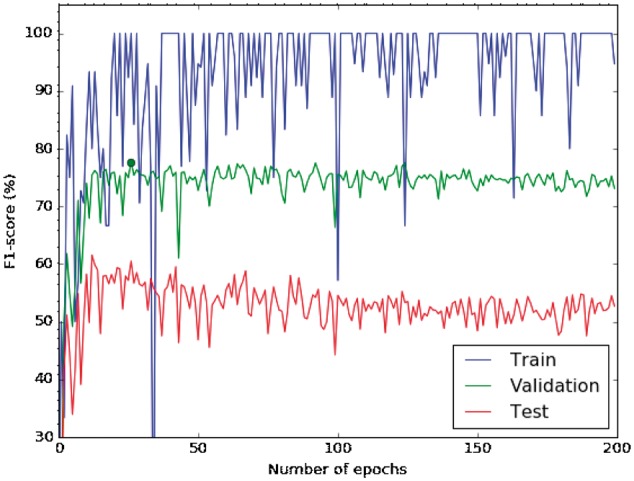
Learning curve of a CNN with random initialization. The blue line shows the training-curve variation along the number of epochs, the green represents the validation and the red one the testing curve.
Official websites use .gov
A
.gov website belongs to an official
government organization in the United States.
Secure .gov websites use HTTPS
A lock (
) or https:// means you've safely
connected to the .gov website. Share sensitive
information only on official, secure websites.
Learning curve of a CNN with random initialization. The blue line shows the training-curve variation along the number of epochs, the green represents the validation and the red one the testing curve.