
Figure 1.
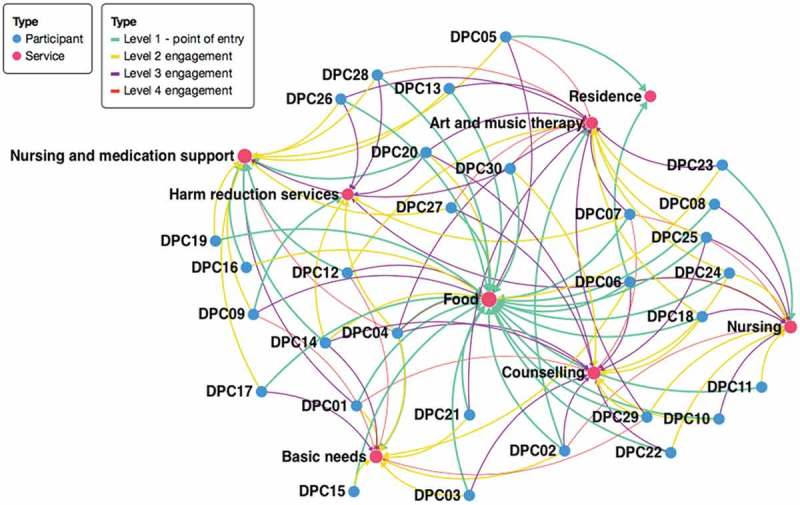
Aggregate participant trajectories by levels of engagement (n = 30). Coloured lines represent levels of engagement with the integrated service environment (teal: point of entry; yellow: second level engagement; purple: third level engagement; red: fourth level engagement).