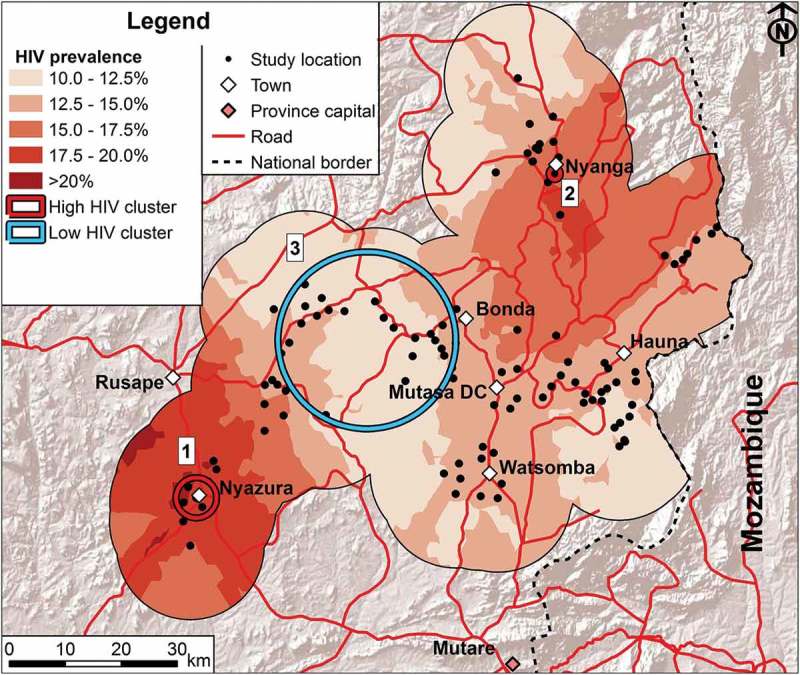
Figure 2.

HIV prevalence in the study area. Interpolation of age-standardized HIV prevalence for both sexes combined. Clusters of HIV prevalence are indicated with the numbers corresponding to the numbers in Table 1. For further details on the methodology and the maps for each sex separately see supplementary material.
