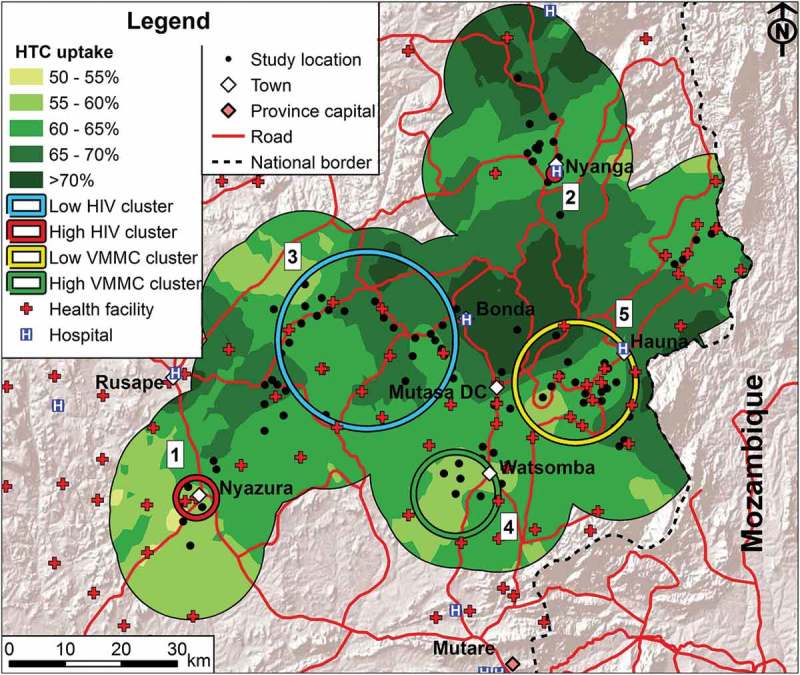
Figure 3.

HTC and VMMC uptake in the study area in relation to health service availability. Spatial patterns of uptake of age-standardized HTC uptake (shadings on the map) and locations of VMMC uptake clusters (in the south and east) are shown in relation to the availability of health services (any type of health facility and hospitals) and the locations of the high HIV prevalence clusters (red circles around Nyazura and Nyanga) and the low HIV prevalence cluster (blue circle in the western central area) in the study area, Manicaland, Zimbabwe. The numbers next to the clusters correspond to the numbers of the clusters in Table 1.
