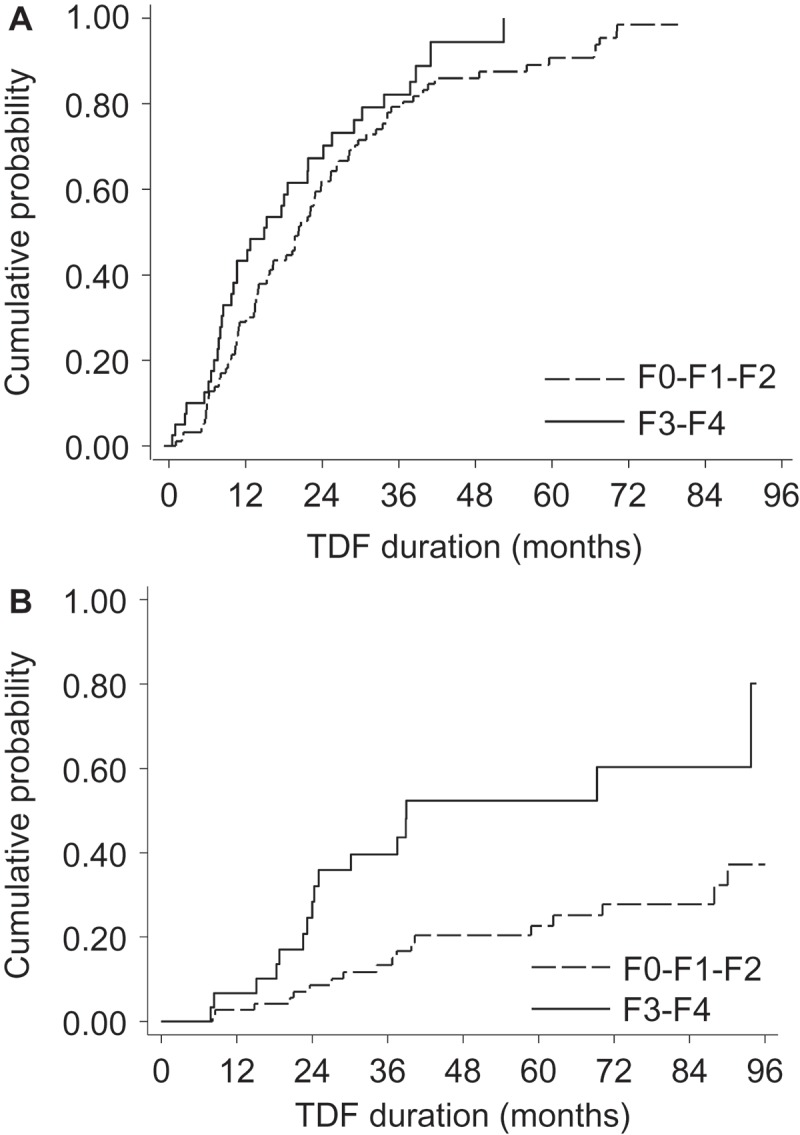
Figure 1.

Baseline liver fibrosis levels and HBV-related endpoints during tenofovir-containing antiretroviral therapy.
Kaplan–Meier curves are used to depict time to HBV-related endpoints during tenofovir (TDF) containing ART, stratified on baseline none/mild/moderate liver fibrosis (F0–F1–F2) and fibrosis/cirrhosis (F3–F4). Time to undetectable HBV-DNA (<60 IU/mL) is represented in (a) among patients with detectable HBV-DNA at baseline. Time to HBeAg-seroclearance is represented in (b) among patients with HBeAg-positive serology at baseline.
