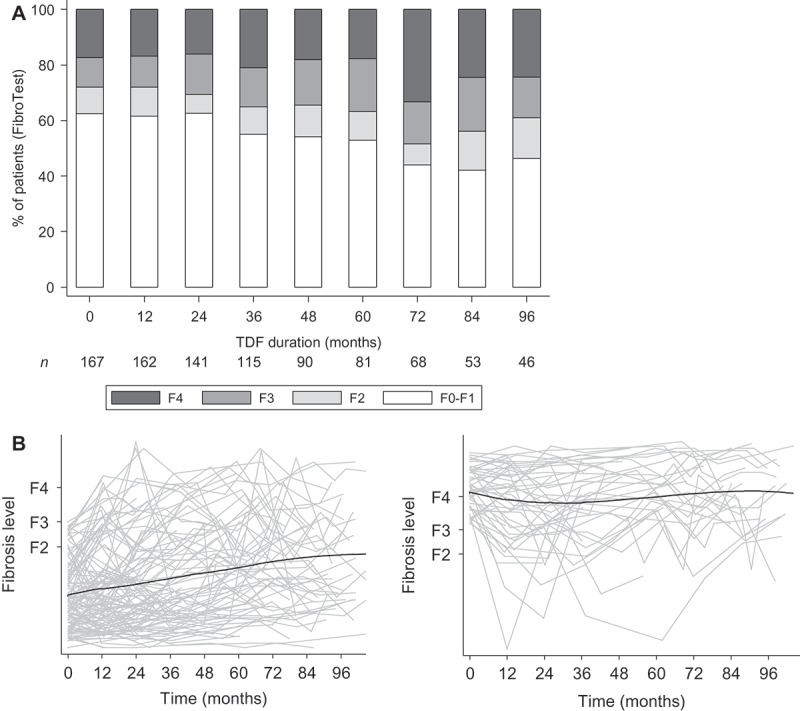
Figure 2.

Liver fibrosis evolution during tenofovir-containing antiretroviral therapy.
In (a), the distribution of liver fibrosis levels is provided at each yearly interval during tenofovir (TDF) containing ART. The number of patients continuing follow-up at the end of each interval is provided below. In (b), individual trajectories of FibroTest® scores in function of their METAVIR fibrosis equivalents are provided in grey lines for patients with <F3 and ≥F3 baseline fibrosis (left and right panels, respectively), while LOWESS plots are given as black lines to depict moving averages over time.
