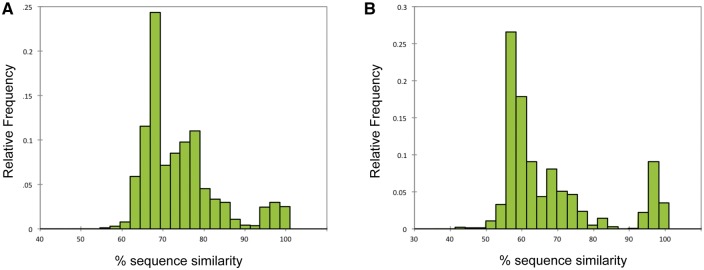
Figure 1.
Histogram of the relative frequency of pairwise sequence identities used to define the cutoff between operating taxonomic units for all CoV sequences detected. A bimodal distribution was observed and a cutoff of 90% sequence identity used to separate sequences from both the Watanabe (Panel A) and Quan (Panel B) assays into discrete viral taxa.

