
Figure 4.
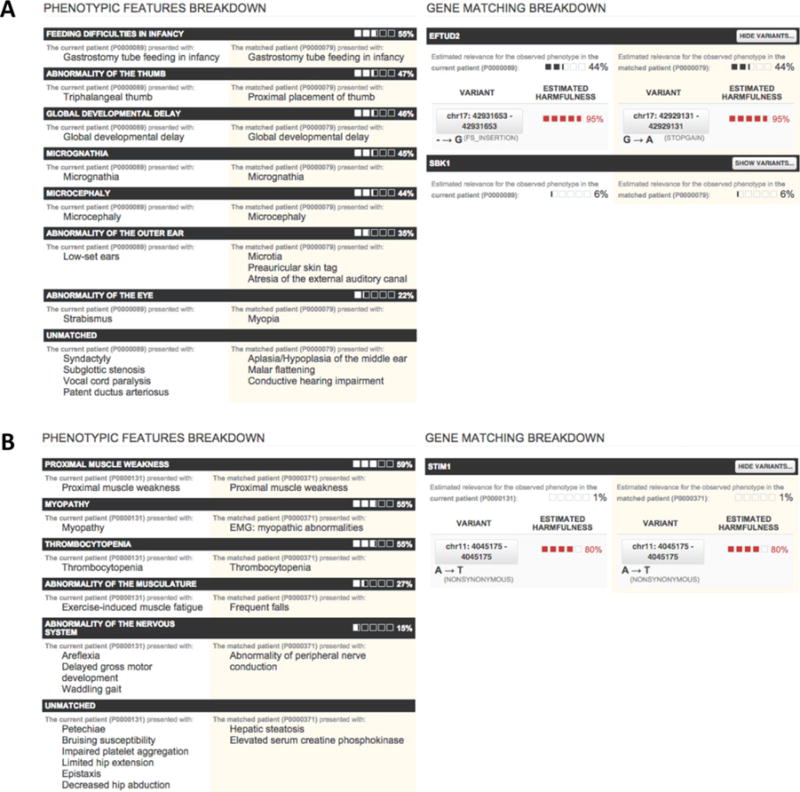
Two validated PhenomeCentral matches, each showing a breakdown of the phenotypic similarity between the two patients on the left, and the genotypic similarity between the two patients on the right. The phenotypes are grouped via a greedy iterative process. In each iteration, the most informative common ancestor is found and all descendants of that term in each patient are removed and displayed as a group. A: The match between two patients with EFTUD2 mutations, where only one was classified as having mandibulofacial MFDM at the outset (the other was described as “CHARGE-like”). B: The match between two patients with STIM1 mutations, subsequently diagnosed with York Platelet syndrome.