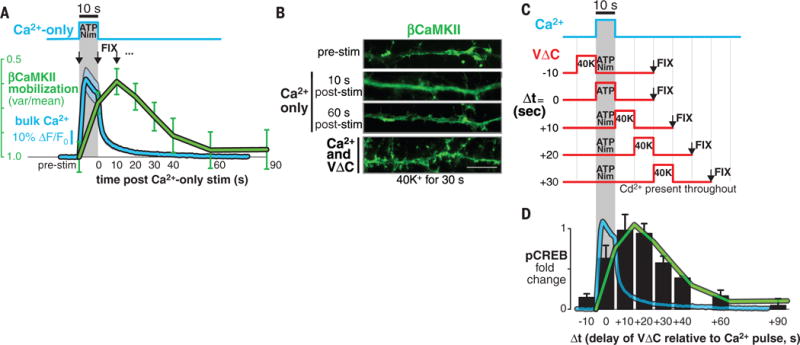
Fig. 3. Temporal dissection of Ca2+ and VΔC signals reveals a slow coincidence detection scheme.

(A) The protocol for the 10-s Ca2+-only pulse produced with ATP plus Nim (top) and the resulting bulk Ca2+ elevation (bottom, blue waveform; ΔF/F0, ratio of fluorescence difference to basal value). Cells were fixed at various time points (black arrows) and βCaMKII mobilization (green waveform) was determined by a variance-over-mean (var/mean) analysis. Blue shading and green bars show means ± SEM of 25 cells from three cortical cultures. (B) Sample images of βCaMKII distribution in response to different stimuli. Ca2+ alone transiently mobilizes βCaMKII (top three images) but does not form βCaMKII puncta (compare with the bottom image). Scale bar, 10 μm. (C) The protocol for temporally shifted 10-s pulses of Ca2+ and VΔC. (D) Nuclear pCREB signaling in response to stimuli in (C) (black bars), overlaid with waveforms from (A). The bars show means ± SEM of 120 cells from four independent cortical cultures.
