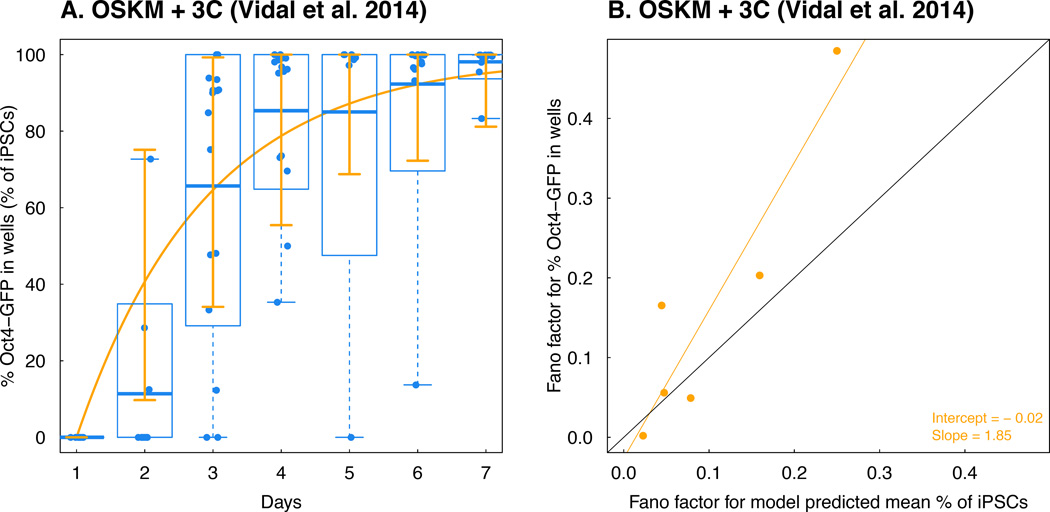
Figure 3. Model validation using time-series Oct4-GFP % in different colonies.
A. A comparison between the model-predicted mean percent iPSC trajectory using the data in the OSKM + AGi experiment from Bar-Nur et al. 2014 and observed percent Oct4-GFP in each colony over time in the OSKM + 3C experiment from Vidal et al. 2014. Again, we obtain a correlation between the observed data and model prediction > 0.95. B. Comparison between Fano factors of percent Oct4-GFP in each colony over time in the OSKM + 3C experiment from Vidal et al. 2014 and model-predicted Fano factors based on data from the OSKM + AGi experiment from Bar-Nur et al. 2014. The black line corresponds to the 45 degree “y = x” curve.

