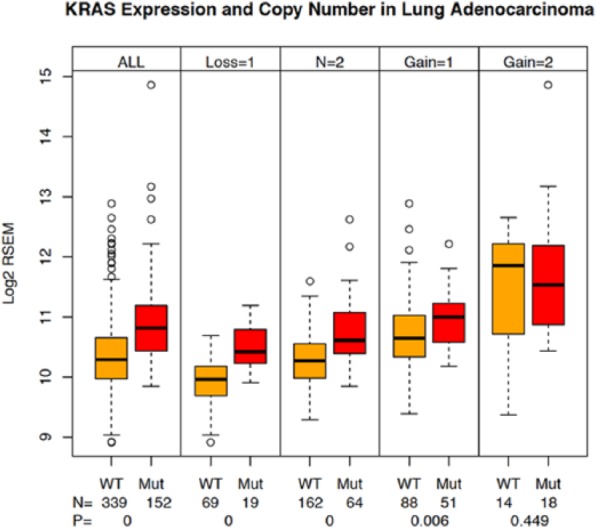
Figure 4.

KRAS expression and CNV in lung adenocarcinoma samples. Sample subsets were prepared from the lung adenocarcinoma tumor samples to capture pairs (KRAS wild type and KRAS mutant) of samples in each of the 5 possible CNV states (−2, −1, 0, +1, +2) using the GISTIC scores.12 KRAS expression was plotted for each sample subset. The numbers of samples in each group and the associated t test P values are shown on the plot. Lane 1—all KRAS WT samples, lane 2—all KRAS-mutant samples, lane 3—KRAS WT samples with CNV = −1, lane 4—KRAS-mutant samples with CNV = −1, lane 5—KRAS WT samples with CNV = 0, lane 6—KRAS-mutant samples with CNV = 0, lane 7—KRAS WT samples with CNV = +1, lane 8—KRAS-mutant samples with CNV = +1, lane 9—KRAS WT samples with CNV = +2, lane 10—KRAS-mutant samples with CNV = +2. CNV indicates copy number variation; GISTIC, Genomic Identification of Significant Targets in Cancer; WT, wild type.
