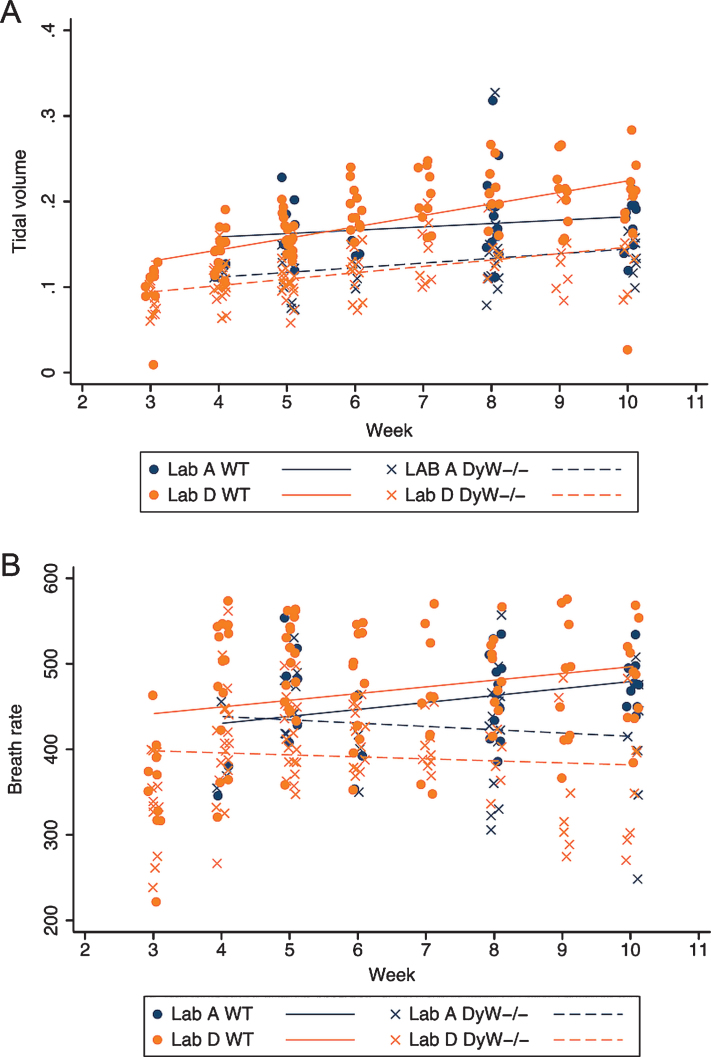
Fig.7.
Tidal volume and Breath rate over time in both WT and DyW mice. (A) The change in tidal volume over time is shown for both WT and DyW mice from the two laboratories reporting results. Individual tidal volume in WT mice are represented with circles and regression lines from the mixed effects linear model are represented by solid lines. Individual tidal volume in DyW mice are represented with X’s and regression lines from the mixed effects linear model are represented by dashed lines. (B) The change in breath rate over time is shown for both WT and DyW mice from the two laboratories reporting results. Individual breath rate in WT mice are represented with circles and regression lines from the mixed effects linear model are represented by solid lines. Individual tidal volume in DyW mice are represented with X’s and regression lines from the mixed effects linear model are represented by dashed lines.

