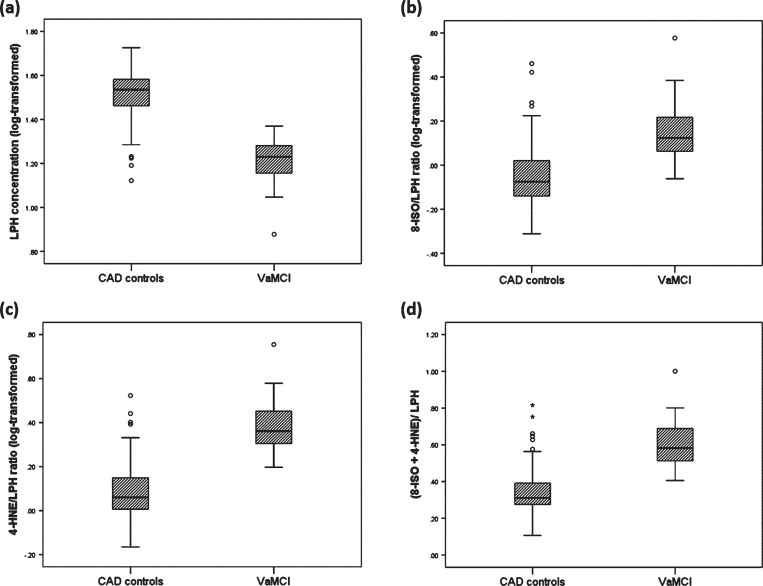
Fig.1.
Box plot displaying the distribution of the data based on median and interquartile range showing differences in lipid peroxidation markers (A) LPH; (B) 8-ISO/LPH; (C) 4-HNE/LPH); (D) (8-ISO+4-HNE)/LPH between CAD patients without cognitive impairment (CAD controls; n = 89) and those with cognitive impairment (VaMCI group; n = 29). The LPH concentration was significantly lower in VaMCI group as compared of CAD controls, but the ratio between late to early stage lipid peroxidation markers were significantly greater in the VaMCI group as compared to CAD controls. Values are adjusted group mean±SD.

