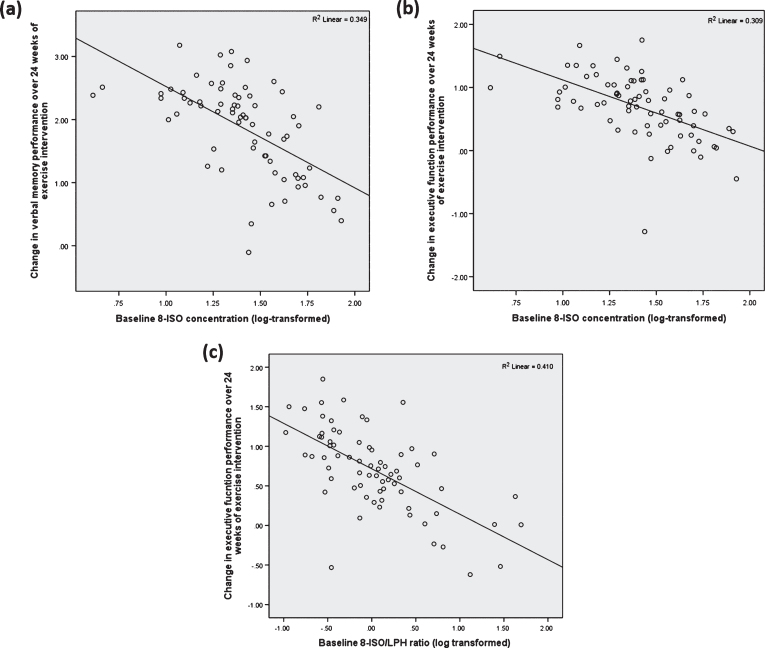
Fig.2.
Scatterplot illustrating statistically significant associations between (A) 8-ISO concentration and change in verbal memory performance (R2 = 0.124, p = 0.033) following 24 weeks of exercise intervention and; (B) significant associations between executive function and 8-ISO (R2 = 0.137, p = 0.026), (C) 8-ISO/LPH (R2 = 0.154, p = 0.013) when adjusting for sex, BMI, years of education, and VO2 peak. Y-axis represents adjusted predicted value based on applied linear regression model.

