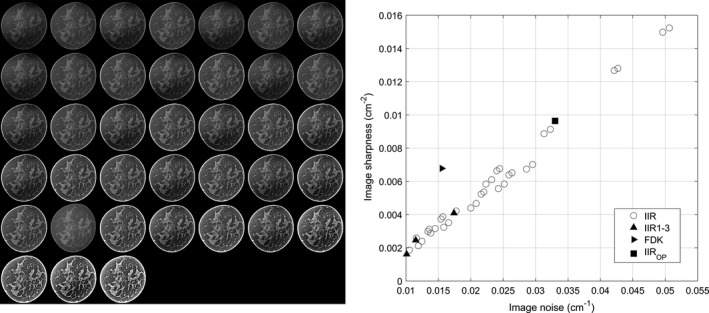
Figure 2.

The left side shows an example of the coronal views of a breast for the 38 different reconstructions used in this study. We ordered the views in terms of their sharpness values (from left to right and from top to bottom, the image sharpness increases). The right side shows the scatter plot of image appearance values (i.e., noise and sharpness) for all 38 reconstructions. IIR1–3 and FDK refer to IIR and FDK reconstruction cases used for the observer study. IIROP indicates a candidate reconstruction we found in this study for a CADx algorithm.
