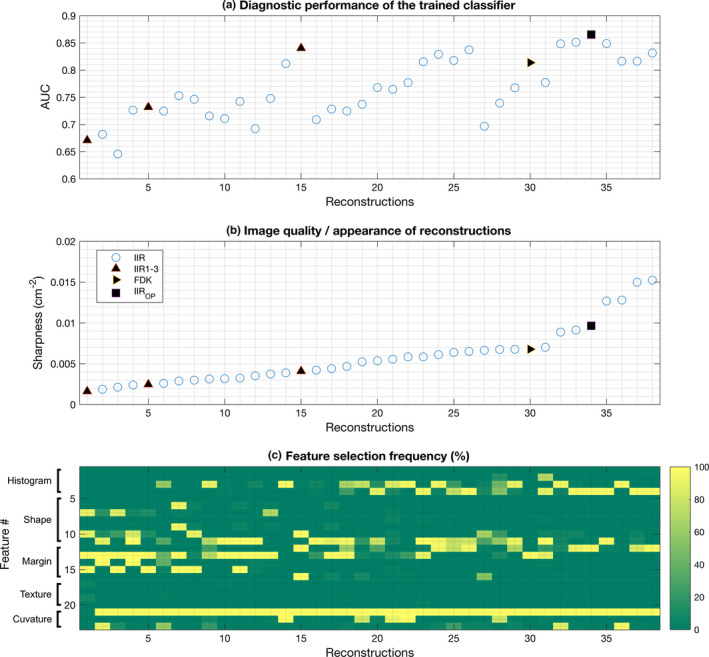
Figure 4.

This figure shows the selected features for the classifier and its diagnostic performances on each reconstruction. (a) shows the AUC of the classifier on each reconstruction. (b) shows the sharpness of each reconstruction. (c) shows the selection frequency of each feature in the classifier for each reconstruction. Feature #1–#4, #5–#11, #12–#16, #17–#20, and #21–#23 represent histogram, shape, margin, texture, and curvature features, respectively. As sharpness increased, the diagnostic performance of the classifier improved (a and b). Overall, the total curvature feature (feature #21) was selected 100% for all reconstructions except the smoothest reconstruction. For smooth reconstruction, the classifier frequently used the shape and margin descriptors. For sharp reconstruction, the classifier frequently used the margin and histogram descriptors. As images got sharper, the type and the number of selected features were reduced and stabilized. [Colour figure can be viewed at wileyonlinelibrary.com]
