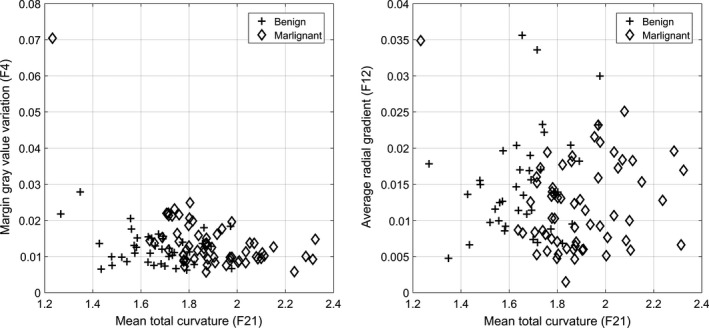
Figure 5.

This figure shows the scatter plots of the selected features (F4, F12, and F21) for the classifier on the reconstruction #34. Malignant lesions tended to have higher Margin gray value variation (F4) and Total curvature (F21) values and lower Average radial gradient (F12) values than benign lesions.
