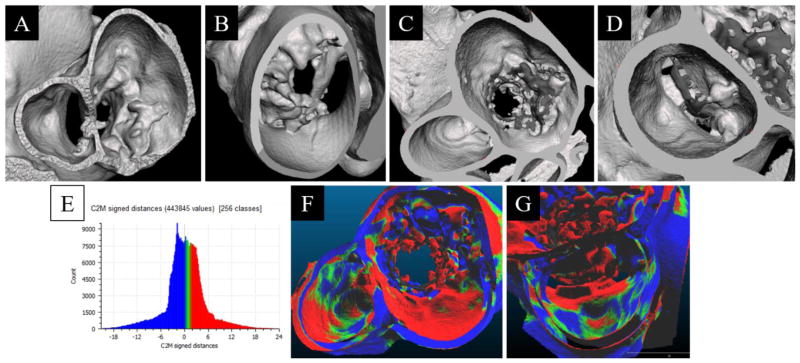
Figure 10.
Segmented view of the baseline phantom geometry, reconstructed from 3D-DA, as if viewing from the left Atrium/LVOT (A) and left ventricle (B). Segmented view of the 23mm SAPIEN XT implant phantom, reconstructed from 3D-DA, as if viewing from the left atrium (C) and LVOT (D). Histogram of the signed distance transform between the baseline and implanted geometries (E). Comparison of the difference between the Baseline and 23mm SAPIEN XT implant phantom overlain on the implant phantom with a viewpoint centered from the left atrium (F) and the LVOT (G). Color scale represents direction of vertex motion (green/blue mix is no change; blue is surface contraction; green and red is surface bulge).

