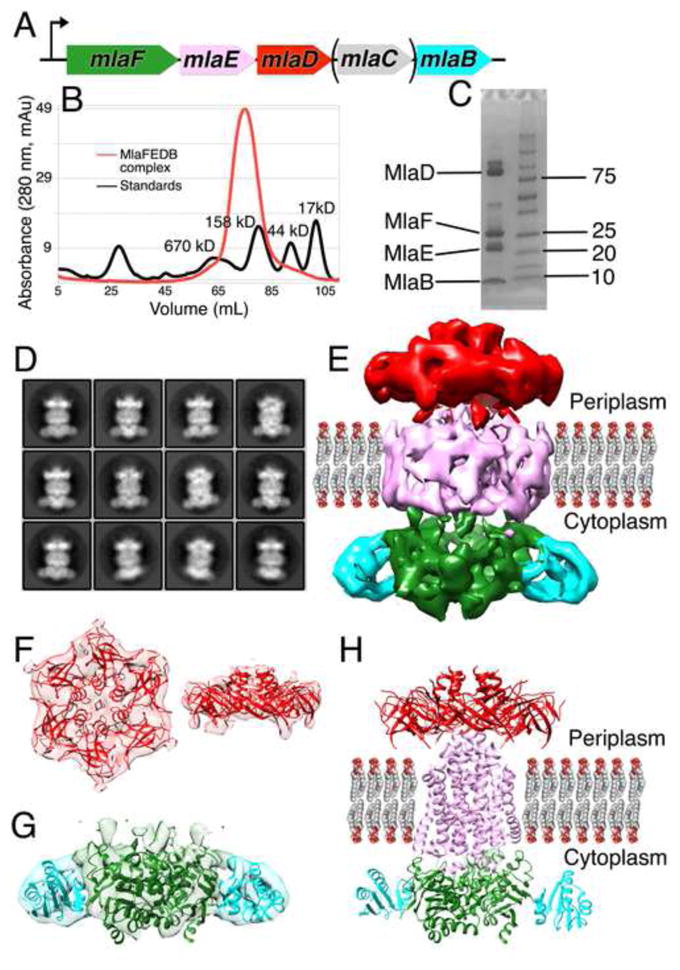
Figure 3. MlaD is part of a large transport complex in the IM.

(A) Co-expression of MlaFEDCB with 6xHis tagged MlaD.
(B) Gel filtration of detergent solubilized MlaD yields a high molecular weight complex.
(C) SDS-PAGE and mass spectrometry demonstrate that MlaF, MlaE, MlaD, and MlaB form a complex.
(D) 2D cryo-EM class averages for the MlaFEDB.
(E) 3D reconstruction of MlaFEDB complex. Density colored to indicate locations of MlaD (red), MlaF (green), MlaB (cyan), and TM domain (pink, including MlaE, MlaD TM helices, and amphipol).
(F) Left, top view (from the OM towards the IM) and right, side view of periplasmic EM density fit with hexameric MlaD crystal structure.
(G) Side view of the cytoplasmic EM density, fit with homology models of MlaF (green) and MlaB (cyan).
(H) Hybrid model of MlaFEDB complex. MlaD crystal structure (red), homology models of MlaF (green) and MlaB (cyan), and de novo, computationally predicted model for MlaE (pink). The MlaD TM are not depicted.
