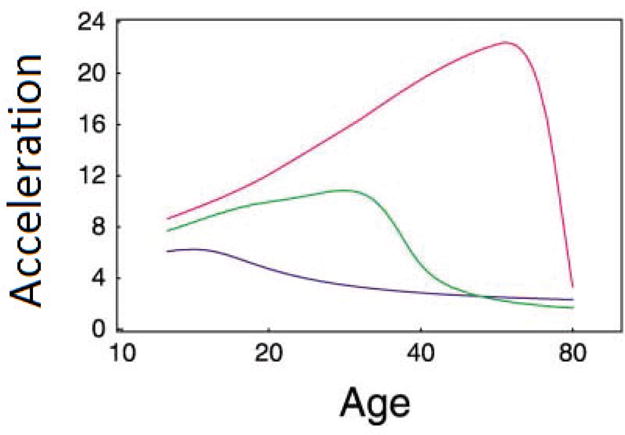
Figure 8.

Patterns of age-specific acceleration for different genotypes at a hypothesized QTL. Three genotypes show different forms of acceleration curves, indicating the role of the QTL in cancer pathogenesis. The first genotype QQ is denoted by a blue curve, for which clonal expansion occurs only in the last round before cancer, so KM − 2 = KM − 3 = 1; the second genotype is denoted by a green curve, whose clonal expansion occurs in the last two rounds before cancer, with KM − 2 = 106 and KM − 3 = 1; and the third genotype is denoted by a red curve, where clonal expansion occurs in the last three rounds before cancer, with KM − 2 = KM − 3 = 106. The mutation rates for these three genotypes are vm = 5.8 × 10⁻⁴, 9.3 × 10⁻⁵, and 1.55 × 10⁻⁶ for m mutations to keep the total incidence of cancer at 10%, respectively. Basic parameters are M = 4, x0(0) = 104, rm = 0.5 for all m, K0 = 1, and K M − 1 = 106. This example was made up from Frank’s [43] analysis.
