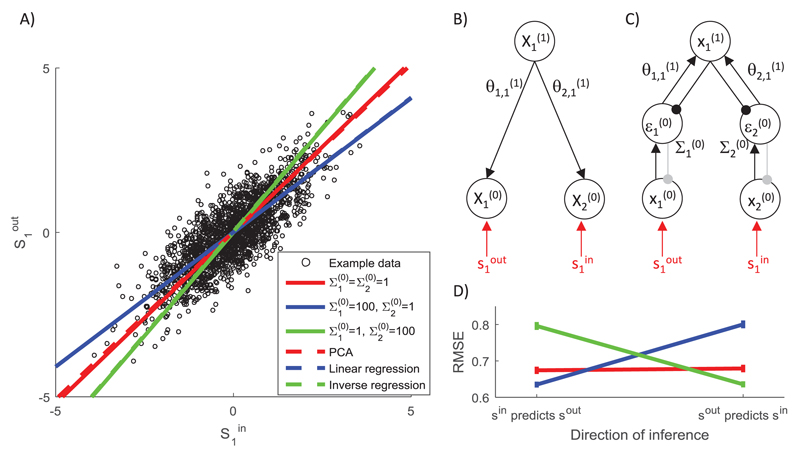
Figure 7.
The effect of variance associated with different inputs on network predictions. (A) Sample training set composed of 2000 randomly generated samples, such that and where a ~ (0, 1) and b ~ (0,1/9). Lines compare the predictions made by the model with different parameters with predictions of standard algorithms (see the key). (B) Structure of the probabilistic model. (C) Architecture of the simulated predictive coding network. Notation as in Figure 2. Connections shown in gray are used if the network predicts the value of the corresponding sample. (D) Root mean squared error (RMSE) of the models with different parameters (see the key in panel A) trained on data as in panel A and tested on a further 100 samples generated from the same distribution. During the training, for each sample the network was allowed to converge to the fixed point as described in the caption of Figure 5 and the weights were modified with learning rate α = 1. The entire training and testing procedure was repeated 50 times, and the error bars show the standard error.

