Figure 1.
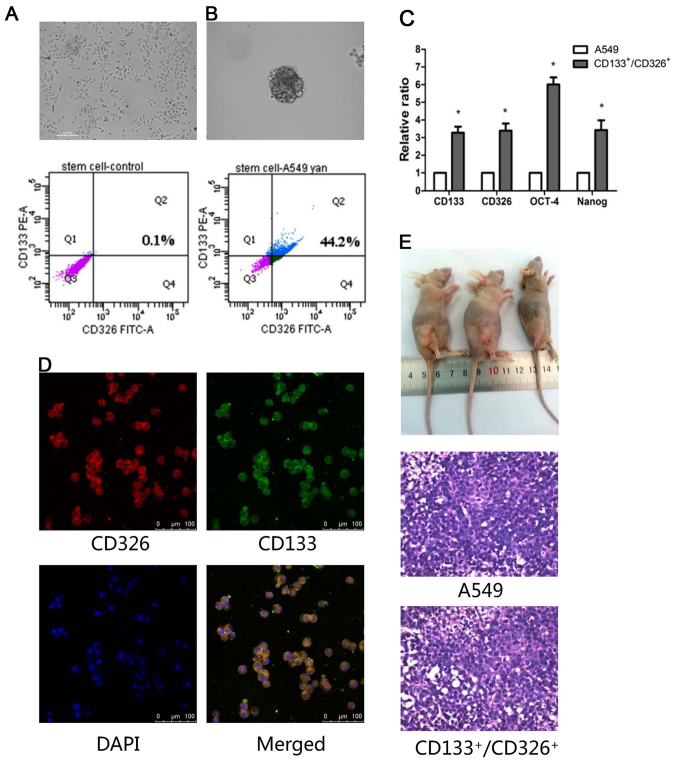
Identification of the CD133+/CD326+ subpopulation as CSLCs of A549. (A) The expression of CD133+/CD326+ in A549 cells. (B) The representative image of A549 spheroids in serum-free medium and the CD133+/CD326+ expression. (C) The expression of CD133, CD326, OCT-4 and Nanog in A549 cells and CD133+/CD326+ cells as measured by quantitative real-time PCR (*p<0.05). (D) Confocal microscopy of A549 spheroids in serum-free medium stained in situ with anti-CD133 antibody and anti-CD326 antibody; cell nuclei were counterstained with DAPI. (E) Xenografts in nude mice (left to right, 1×10⁵, 1×10⁴, 1×10³ CD133+/CD326+ cells). All mice were sacrificed after 6 weeks and tumors were examined by H&E staining, ×400.

