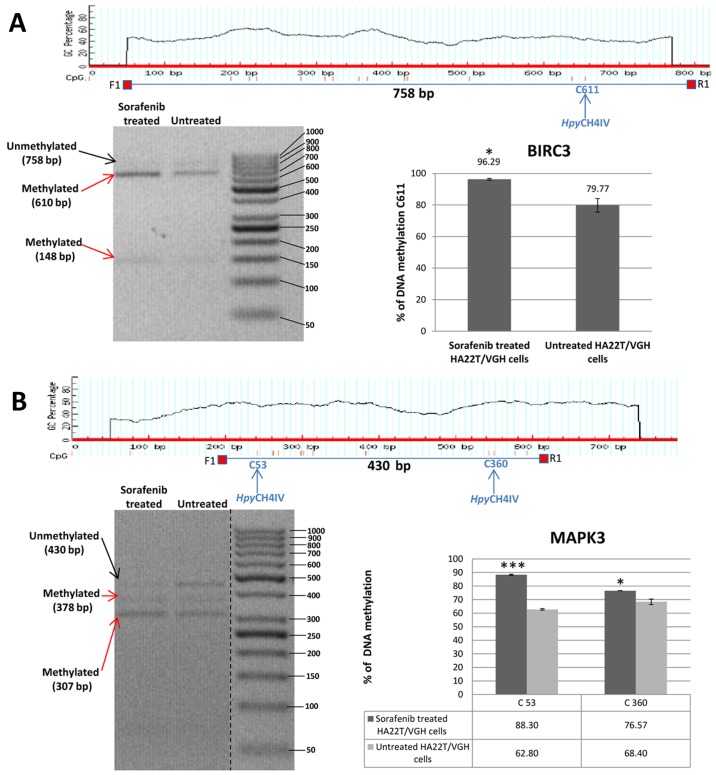
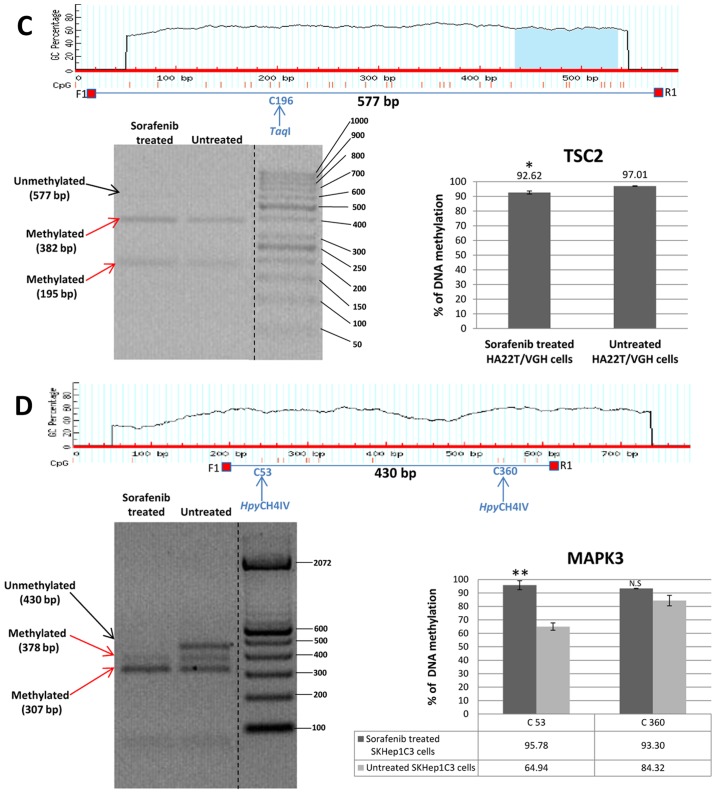
Figure 4.
Validation of MeDip-chip results by COBRA assay in sorafenib treated and untreated HCC cells. (A) The DMR associated to BIRC3 gene was 1,944 bp long and the primers were designed to amplify a 758 bp fragment from nucleotides 1,032 to 1,790 relative to the DMR start. The digested bands (610 and 148 bp) indicate the presence of methylation (red arrows). The band at the top (758 bp) corresponds to undigested DNA (black arrow). The histograms indicate the level of methylation in cytosine 611 in sorafenib treated cells and untreated cells by COBRA analysis. The results indicated a hypermethylation of cytosine 611 in sorafenib treated cells. (B) The DMR associated to MAPK3 gene was 2,255 bp long and the primers were designed to amplify a 430 bp fragment from nucleotides 1,660 to 2,090 relative to the DMR start. The digested bands (378 and 307 bp) indicate the presence of methylation (red arrows). The band at the top (430 bp) corresponds to undigested DNA (black arrow). The bands of 52 and 71 bp were not visible on the gel. The histograms indicate the level of methylation in cytosine 53 and cytosine 360 in sorafenib treated cells and untreated cells by COBRA analysis. The results indicated a hypermethylation of cytosine 53 and cytosine 360 in sorafenib treated cells. All the assays were performed using 3.0% gel in 1X TBE. Error bars of the histograms are referred to standard deviation of the means of two experiment performed. *P<0.05, **P<0.01 and ***P<0.001 indicate that expression difference between the two cellular conditions was statistically significant. Results of one representative experiment of two independent experiments are shown. Validation of MeDip-chip results by COBRA assay in sorafenib treated and untreated HCC cells. (C) The DMR associated to TSC2 gene was 3,403 bp long and the primers were designed to amplify a 577 bp fragment from nucleotides 1,107 to 1,684 relative to the DMR start. The digested bands (382 and 195 bp) indicate the presence of methylation (red arrows). The band at the top (577 bp) corresponds to undigested DNA (black arrow). The histograms indicate the level of methylation in cytosine 196 in sorafenib-treated cells and untreated cells by COBRA analysis. The results indicated a slight hypomethylation of cytosine 196 in sorafenib treated cells. All the assays were performed using 3.0% gel in 1X TBE. The COBRA analysis was also conducted in sorafenib treated and untreated SKHep1C3 cells. In SKHep1C3 (D) cells the DMR associated to MAPK3 gene was found hypermethylated in sorafenib treated cells compared to untreated cells. In particular, the results indicated a hypermethylation of cytosine 53 in sorafenib treated cells. All the assays were performed using 3.0% gel in 1X TBE. Error bars of the histograms are referred to standard deviation of the means of two experiment performed. *P<0.05, **P<0.01 and ***P<0.001 indicate that expression difference between the two cellular conditions was statistically significant. N.S means that the results was not statistically significant. Results of one representative experiment of two independent experiments are shown.


