Figure 5.
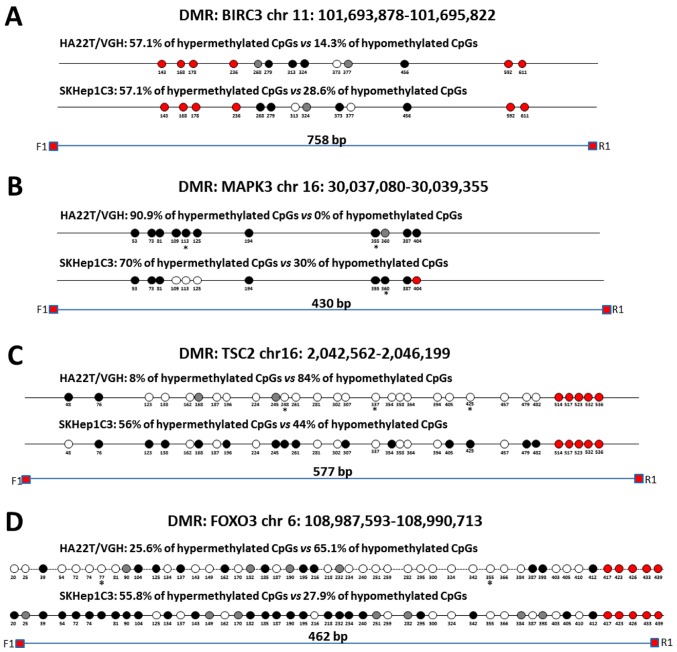
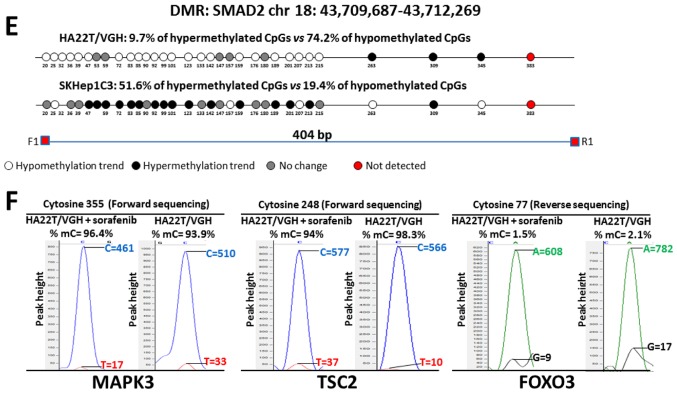
Validation of MeDip-chip results by direct bisulfite sequencing in sorafenib-treated and -untreated HCC cells. Forward sequencing chromatogram peaks for thymine (unmethylated) and cytosine (methylated) or reverse sequencing chromatogram peaks for adenine (unmethylated) and guanine (methylated) were compared in bisulfite treated DNA to determine the average level of methylation for each CpG within a given sample. The white and black circles indicate that the mean level of CpG methylation in sorafenib-treated cells was lower (hypomethylation) or higher (hypermethylation) respect to untreated cells. Grey circles indicate that the mean level of CpG methylation was the same in the two cellular conditions (difference <0.1% was not considered relevant). Red circles indicate undetected CpGs. *P<0.05 and **P<0.01 indicate that methylation difference between the two cellular conditions was statistically significant. (A) For BIRC3 in HA22T/VGH, 4 out 7 CpGs showed a hypermethylation trend in sorafenib treated cells, while 1 of 7 CpGs showed a hypomethylation trend. For BIRC3 in SKHep1C3, 4 out 7 CpGs showed a hypermethylation trend in sorafenib-treated cells, while 2 of 7 CpGs showed a hypomethylation trend. The primer set was designed to amplify a 758 bp fragment from nucleotides 1,032 to 1,790 relative to the DMR start. (B) For MAPK3 in HA22T/VGH, 10 out 11 CpGs showed a hypermethylation trend in sorafenib-treated cells, while 0 out 11 CpGs showed a hypomethylation trend. For MAPK3 in SKHep1C3, 7 out 10 CpGs showed a hypermethylation trend in sorafenib-treated cells, while 3 out 10 CpGs showed a hypomethylation trend. The primer set was designed to amplify a 430 bp fragment from nucleotides 1,660 to 2,090 relative to the DMR start. (C) For TSC2 in HA22T/VGH, 21 out 25 CpGs showed a hypomethylation trend in sorafenib-treated cells, while 2 out 25 CpGs showed a hypermethylation trend. For TSC2 in SKHep1C3, 11 out 25 CpGs showed a hypomethylation trend in sorafenib-treated cells, while 14 out 25 CpGs showed a hypermethylation trend. The primer set was designed to amplify a 577 bp fragment from nucleotides 1,107 to 1,684 relative to the DMR start. (D) For FOXO3 in HA22T/VGH, 28 out 43 CpGs showed a hypomethylation trend in sorafenib-treated cells, while 11 of 43 CpGs showed a hypermethylation trend. For FOXO3 in SKHep1C3, 12 out 43 CpGs showed a hypomethylation trend in sorafenib-treated cells, while 24 of 43 CpGs showed a hypermethylation trend. The primer set was designed to amplify a 430 bp fragment from nucleotides 1,780 to 2,242 relative to the DMR start. Validation of MeDip-chip results by direct bisulfite sequencing in sorafenib treated and untreated HCC cells. (E) For SMAD2 in HA22T/VGH, 23 out 31 CpGs showed a hypomethylation trend in sorafenib-treated cells, while 3 out 31 CpGs showed a hypermethylation trend. For SMAD2 in SKHep1C3, 6 out 31 CpGs showed a hypomethylation trend in sorafenib-treated cells, while 16 out 31 CpGs showed a hypermethylation trend. The primer set was designed to amplify a 404 bp fragment from nucleotides 2,118 to 2,581 relative to the DMR start. (F) Examples of chromatogram peaks for thymine (unmethylated) and cytosine (methylated; forward sequencing) and for adenine (unmethylated) and guanine (methylated; reverse sequencing) relative to CpGs whose mean differences in DNA methylation were statistically significant between the two cellular conditions.


