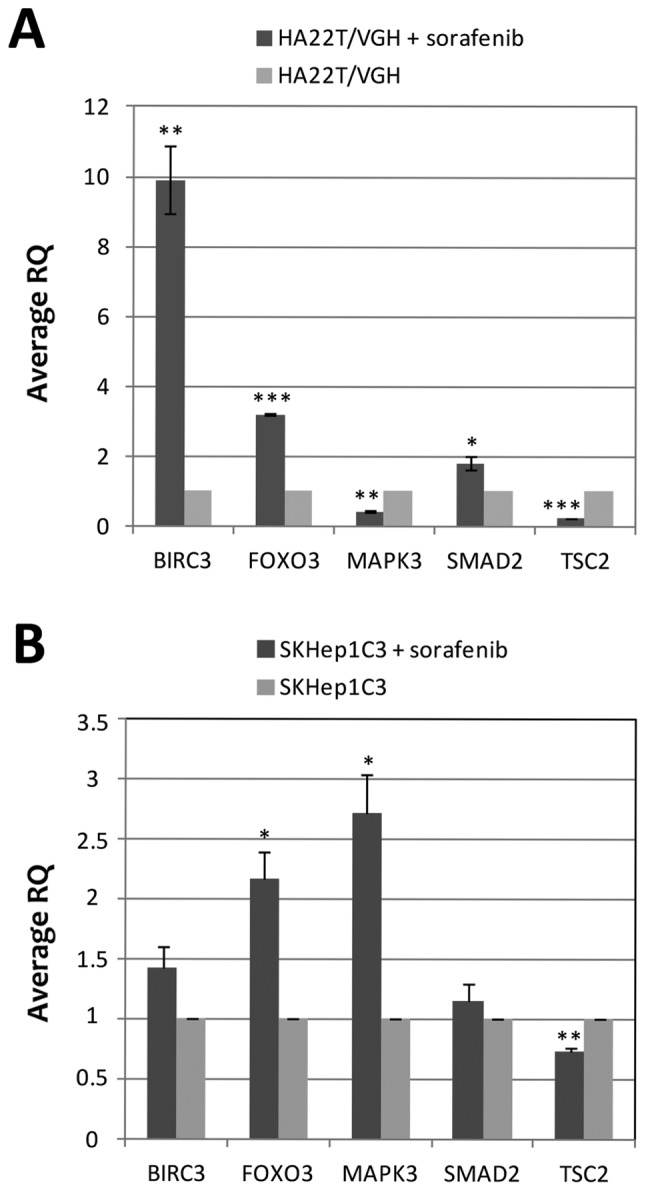
Figure 6.

Evaluation of mRNA expression by RT-qPCR in sorafenib treated and untreated HCC cells. The mRNA expression of the genes BIRC3, FOXO3, MAPK3, SMAD2 and TSC2 was evaluated in HA22T/VGH (A) and SKHep1C3 (B) sorafenib-treated and untreated cells by RT-qPCR, to establish the relationship between DNA methylation changes and gene expression. Relative expression was calculated using ΔΔCt method and an untreated cell sample as a reference. The housekeeping gene YWHAZ was used. Error bars of the RQ panels refer to standard deviation of the RQ means of the two experiment performed. *P<0.05, **P<0.01 and ***P<0.001 indicate that the expression difference between the two cellular conditions was statistically significant.
