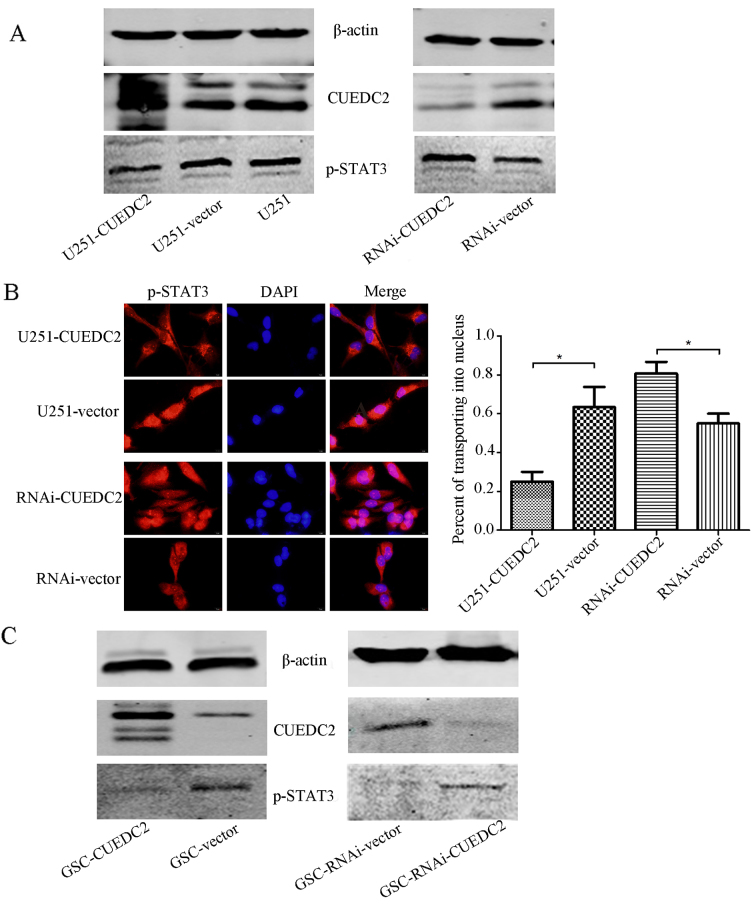
Figure 9.
Effects of overexpression or knockdown of CUEDC2 on the phosphorylation of STAT3 (A and C) and the translocation of p-STAT3 from cytoplasm to nucleus (B) in the U251 cell (A) and GSC (C) was determined by western blot analysis and immunofluorescence. (A and C) Effects of the overexpression or knockdown of CUEDC2 on the phosphorylation of the STAT3 in the U251 cell (A) and GSC (C) was determined by the western blot analysis. Immunofluorescence images of p-STAT3 in U251-CUEDC2 group and control group. (B) Effects of the overexpression or knockdown of CUEDC2 on the translocation of p-STAT3 from cytoplasm to nuclear (C) in the U251 cells was determined by immunofluorescence (red, p-STAT3; blue, DAPI). Scale bars 20 µm (left and middle) and 5 µm (right). *P<0.05.

