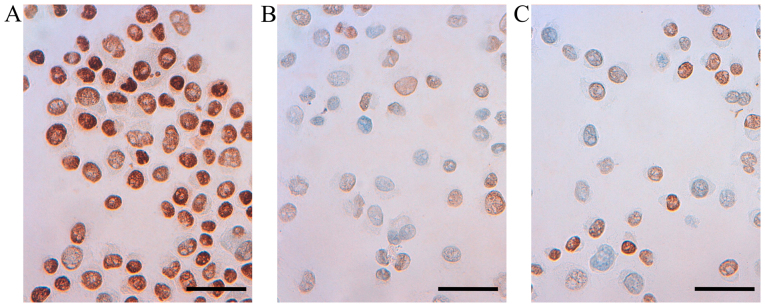
Figure 6.
Representative immunoreactivity for estrogen receptor α (ERα) in T47D breast cancer cell line (A) untreated T47D control cells (B) T47D cells treated with CM from M1 macrophage phenotype for 48 h (C) T47D cells treated with CM from M2 macrophage phenotype for 48 h (×400 magnification, calibration bar is 50 µm in all micrographs).

