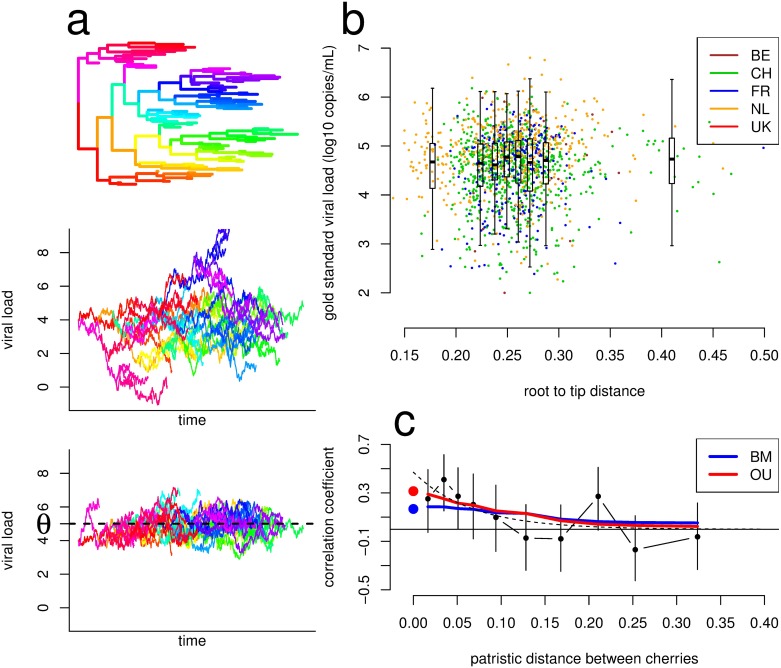
Fig 1. Predictions from the Brownian motion (BM) and Ornstein-Uhlenbeck (OU) models of evolution.
(A) Illustration of the models of character evolution on a phylogeny (top panel), showing unconstrained neutral evolution leading to increasing genetic variance under the BM model (middle panel) versus stabilizing selection around an optimum θ under the OU model, which results in stable variance over time (bottom panel). Edges of the phylogeny were arbitrarily colored for illustrative purposes. (B) The distribution of gold standard viral load (GSVL) over evolutionary time (as quantified by root-to-tip distance [i.e., distance from the common ancestor as assessed by the phylogeny]). Points are the data; boxplots show the median, lower, and upper quartiles, and the whiskers are the lower and upper quartile minus or plus 1.5 times the interquartile range for 8 bins of equal size. (C) The correlation coefficient of GSVL across 511 phylogenetic cherries in the subtype B phylogeny as a function of the patristic distance between cherries. Phylogenetic cherries were grouped by patristic distance in 10 bins of equal size. Points are the data, the dashed line is a decreasing exponential fit on the data, and thick lines show predictions from the maximum likelihood (ML) BM and OU models. The large points at patristic distance 0 show the population-level heritability estimated under the BM (blue) and OU (red) model. The data used in the figure are provided as S1 Data.

