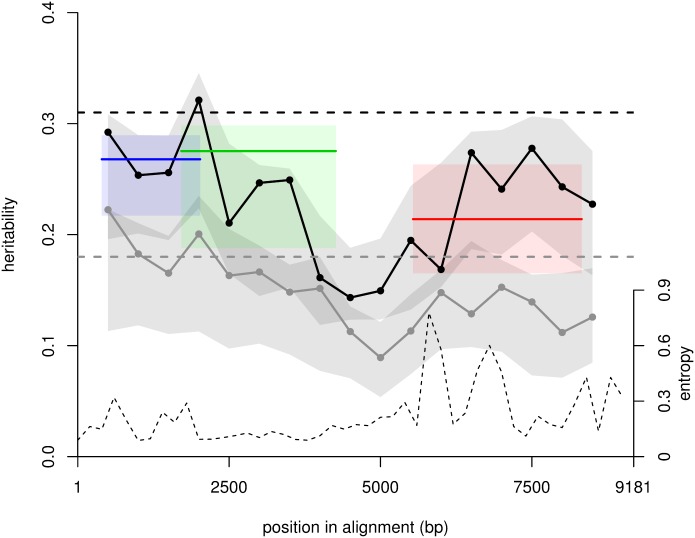
Fig 3. Maximum likelihood estimates of heritability across the genome.
Heritability was inferred for overlapping windows of 1,000 bp separated by 500 bp for the Ornstein–Uhlenbeck (OU) model (black bullets) and the Brownian motion (BM) model (grey bullets). The horizontal dashed lines are the whole-genome heritability estimates. The 3 colored segments show heritability for gag, pol, and env genes in blue, green, red (for OU only). Confidence intervals (grey and colored regions) reflect phylogenetic uncertainty. The largest heritability is in the region where gag and pol overlap. We also show entropy—a measure of genetic diversity—along the genome (dashed curve and right axis). Entropy at a position was calculated as −Σi ∈ {A,C,G,T}pi log(pi), and we show the average entropy over 200-bp windows. The data used in the figure are provided as S1 Data.

