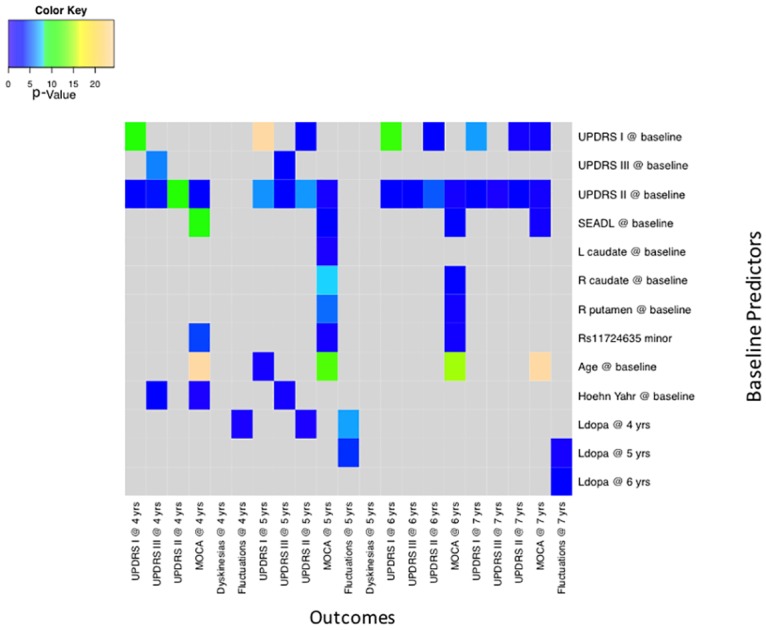
Fig 3. Baseline predictors of study outcomes.

log10(p-value) of perturbation effect upon endpoint variables at various time points. The y-axis shows predictors and the x-axis shows the outcomes at different time points. Terrain colors show the level of significance of the relationship between baseline predictors and outcome variables. UPDRS—Unified Parkinson’s Disease Rating Scale: I—Mental, II—Activities of Daily Living, III- Motor Exam; S/E ADL—Schwab and England Activities of Daily Living; MoCA—Montreal Cognitive Assessment; L and R Caudate—DAT scan striatal binding ratios; RS11724635minor—minor allele of the SNP rs11724635; Ldopa—levodopa equivalents.
