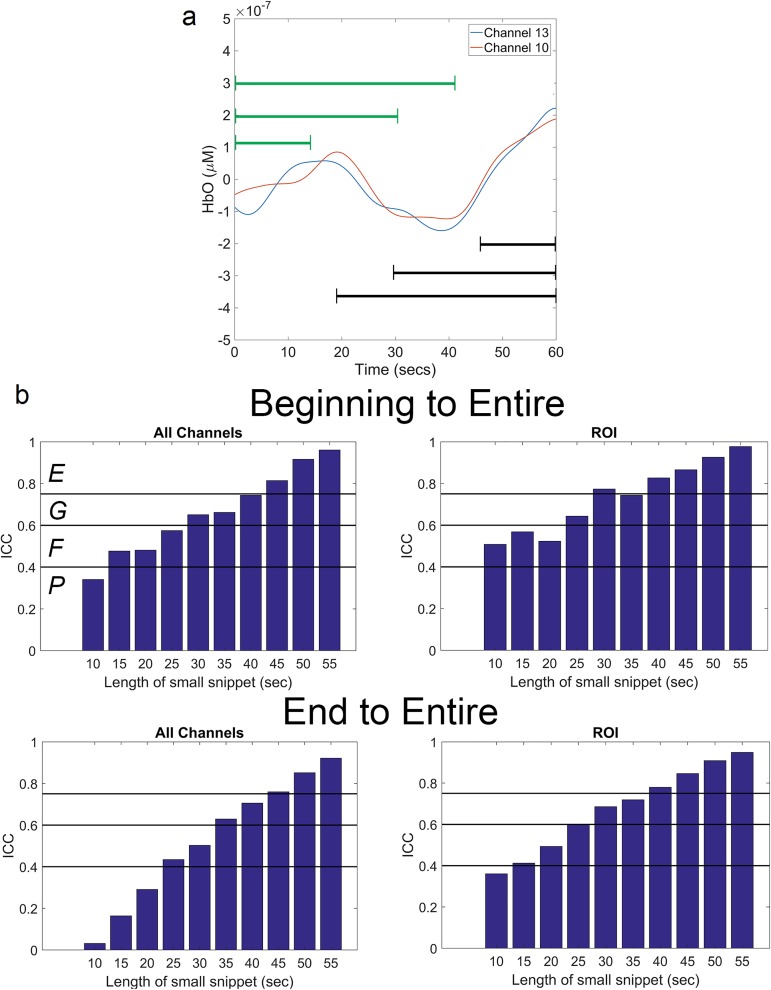
Fig 4. ICC analysis for reproducibility.
(a) Recordings from two channels (same as Fig 3) with arrows depicting examples of the snippets used for ICC analysis. The green arrow represents snippets beginning at the start and the black arrow represents snippets terminating at the end. (b) Mean ICC results of all participants for all connectivity pairs and for connectivity pairs involving the ROI are shown. Top panel depicts results of the beginning snippets and the bottom panel depicts results for the ending snippets. Black horizontal lines indicate the thresholds for the grading scale with abbreviations in top left bar graph serving as a legend (P = poor, F = fair, G = good, and E = excellent).”

