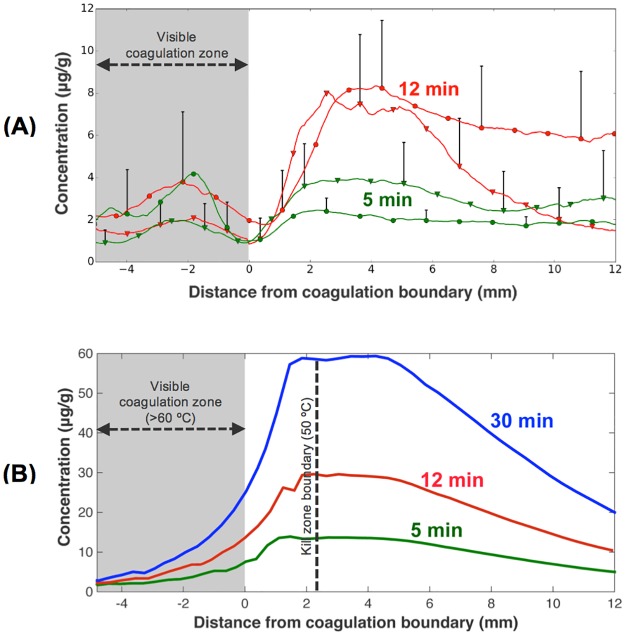
Fig 4. Radial drug concentration profile.
(A) In vivo radial drug concentration profile (see path in Fig 5B, averaged over 360°), referenced to the boundary of the visible coagulation zone. Two heated tissue samples each were evaluated for 5 and 12 min ablation, indicated by circles and triangles. There was statistically significant difference between the two groups (5, 12 min) from 2 to 12 mm distance. (B) Radial drug concentration from computer simulation (calculated 30 min after ablation completion). Drug uptake increases approximately linearly with ablation time for both in vivo study and computer model. Most of the drug is delivered to within ~10–15 mm of the ablation zone boundary. Note that the visible coagulation zone indicated by the gray shaded region in (A) and (B) does not represent the tissue region destroyed by heat. The boundary of the kill zone (= ablation zone = region destroyed by heat) is indicated by a dashed line in (B), and extends ~2.2 mm beyond the visible coagulation zone. I.e. there is no viable tissue zone in-between the ablation zone and the region of drug delivery, as may be assumed from Figs 5 and 6A.

