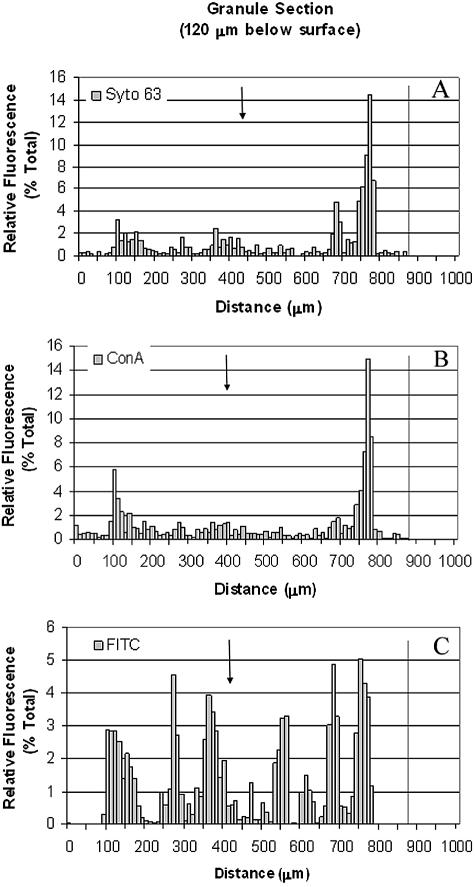
FIG. 4.
Relative fluorescence of each stain through a 20-μm cryosection, cut 120 μm below the granule surface. The granule edge is marked by a dotted line, and an arrow marks the granule center. Cells (Syto 63) (A) and polysaccharides (ConA) (B) are clustered within the first 200 mm of the granule edge, and proteins (FITC) are distributed unevenly throughout the granule (C).

