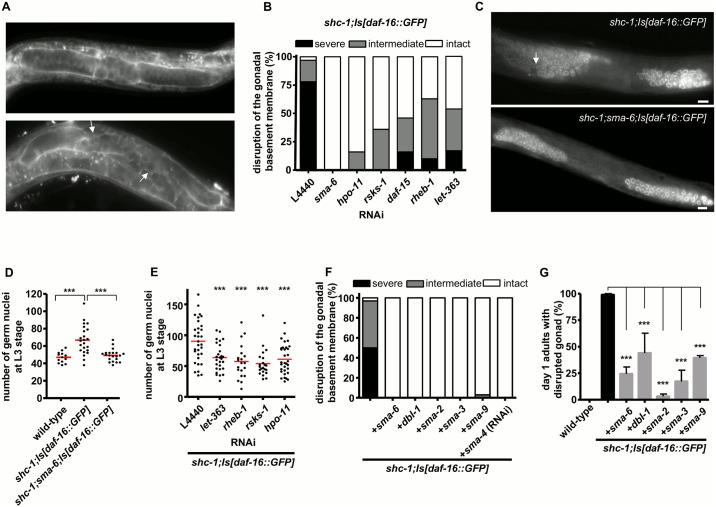
Fig 1. mTORC1 and BMP signaling pathways contribute to the DAF-16 dependent tumorous germline phenotype.
(A) Representative pictures of MitoTracker stained gonadal basement membrane. The white arrows point to disrupted gonadal basement membrane. (B) RNAi knock-down of sma-6, hpo-11 and the components of mTORC1 signaling suppresses the defects in the gonadal integrity in shc-1;Is[daf-16::GFP] animals. (C) Anti-PGL-1 germline antibody staining of shc-1;Is[daf-16::GFP] and shc-1;sma-6;Is[daf-16::GFP] L3 larvae. The white arrow points to hyperplasia in the anterior gonad arm of a representative shc-1;Is[daf-16::GFP] animal (top). In sma-6 mutant background, hyperproliferation is suppressed (bottom). (D) sma-6 mutation significantly decreases the elevated number of the germ cells in the anterior gonad arms of shc-1;Is[daf-16::GFP] L3 animals. Numbers of germ cells per gonad arm ± SEM: wild-type: 47 ± 2 (n = 13); shc-1;Is[daf-16::GFP]: 67 ± 4 (n = 23); shc-1;sma-6;Is[daf-16::GFP]: 49 ± 2 (n = 21) (P<0.0001 compared to shc-1;Is[daf-16::GFP] animals). (E) RNAi knock-down of the components of mTORC1 signaling and hpo-11 significantly decreases the elevated number of the germ cells in shc-1;Is[daf-16::GFP] L3 animals. Numbers of germ cells per gonad arm ± SEM: L4440 control: 90 ± 6 (n = 32); let-363 RNAi: 64 ± 4 (n = 28); rheb-1 RNAi: 57 ± 6 (n = 20); rsks-1 RNAi: 54 ± 5 (n = 22); hpo-11 RNAi: 61 ± 4 (n = 32) (P<0.0001 compared to shc-1;Is[daf-16::GFP] + RNAi L4440 control animals). (F) Inactivation of genes in the BMP signaling pathway completely abolishes gonad disruption in shc-1;Is[daf-16:: GFP] L3 animals. (G) Inactivation of genes in the BMP signaling pathway strongly suppresses gonad disruption in shc-1;Is[daf-16:: GFP] day one adult animals. Scale bar: 10 μm. In this and the following figures, percentages of basement membrane defects are presented as mean ± SD; the mean values and statistical analysis are summarized in S2 Table; the asterisks represent: * P<0.01, ** P<0.001, and *** P<0.0001.

