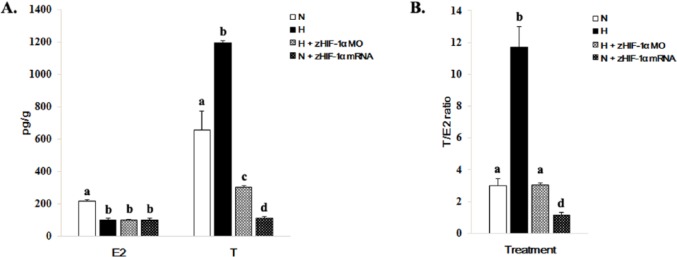
Figure 5.
Effects of hypoxia and overexpression of zHIF-1α on E2 and T levels in zebrafish embryos. (A) Effects of hypoxia and zHIF-1α expression on E2 and T levels. Methods for hypoxic exposure and zHIF-1α overexpression and knockdown are detailed in Figures 1 to 3, respectively. Hormone levels in whole zebrafish embryos (5 replicates of 60 pooled embryos each) were measured by the ELISA method. The data are presented as the mean concentration of hormone (in picograms per gram of embryo wet weight) ± SD. The different letters above the bars indicate statistically significant differences between the indicated groups for the same hormone (P < .05, Student-Newman-Keuls). (B) Effects of hypoxia and zHIF-1α expression on the T/E2 ratios. Data are presented as the mean ± SD (P < .05, Student-Newman-Keuls). The different letters above the bars indicate statistically significant differences between the indicated groups.

