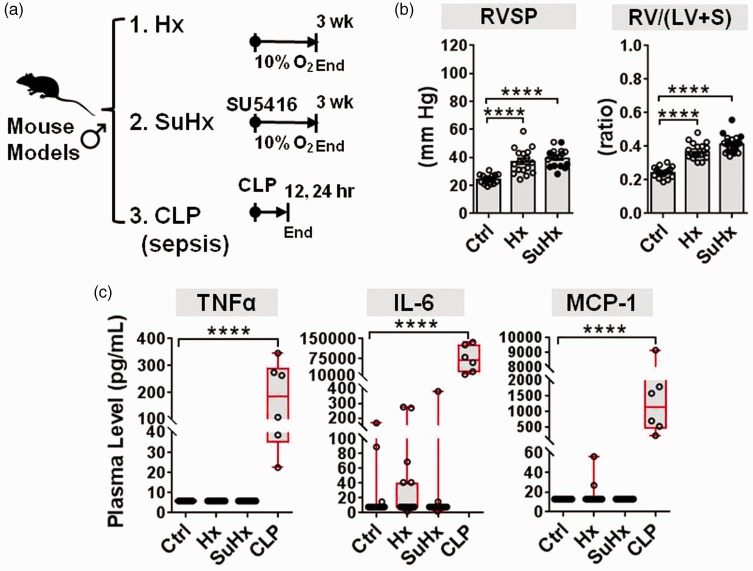
Fig. 2.
Plasma cytokine levels in mouse models of PH. (a) Schematic overview of experimental timelines used for two different mouse models of PH and one mouse model of sepsis. PH was induced in mice by either hypoxia alone (Hx n = 18 mice from four independent experiments) or in combination with SU5416 (SuHx n = 20 mice from three independent experiments). Cytokine levels were measured after three weeks versus controls (Ctrl n = 16 mice from four independent experiments). As a positive control comparator, mice with CLP-induced sepsis were assessed 12–24 h post procedure (CLP n = 6, Ctrl n = 3 mice from one experiment). (b) RVSP and the RV/(LV + S) weight ratio confirm establishment of PH (bar charts denote mean ± SEM). SuHx mice denoted by open circles in bar graphs received three to six doses of SU5416 in an effort to increase PH severity. (c) Plasma levels of target cytokines measured by Milliplex immunoassay. Boxplots denote median and interquartile range, and whiskers denote min/max values. Individual animals are shown as circles. Axes are split on graphs to show distribution of data. Statistical significance of RVSP and RV/(LV + S) was determined by one-way ANOVA and Dunnett’s multiple comparison test. Statistical significance of cytokine changes was determined by non-parametric Kruskal–Wallis with Dunn’s multiple comparison test. *P < 0.05, **P < 0.01, ***P < 0.001, ****P < 0.0001 versus Ctrl group.

